Job Hunting in 2026
We’ll Keep Your Resume on File — A Data Report
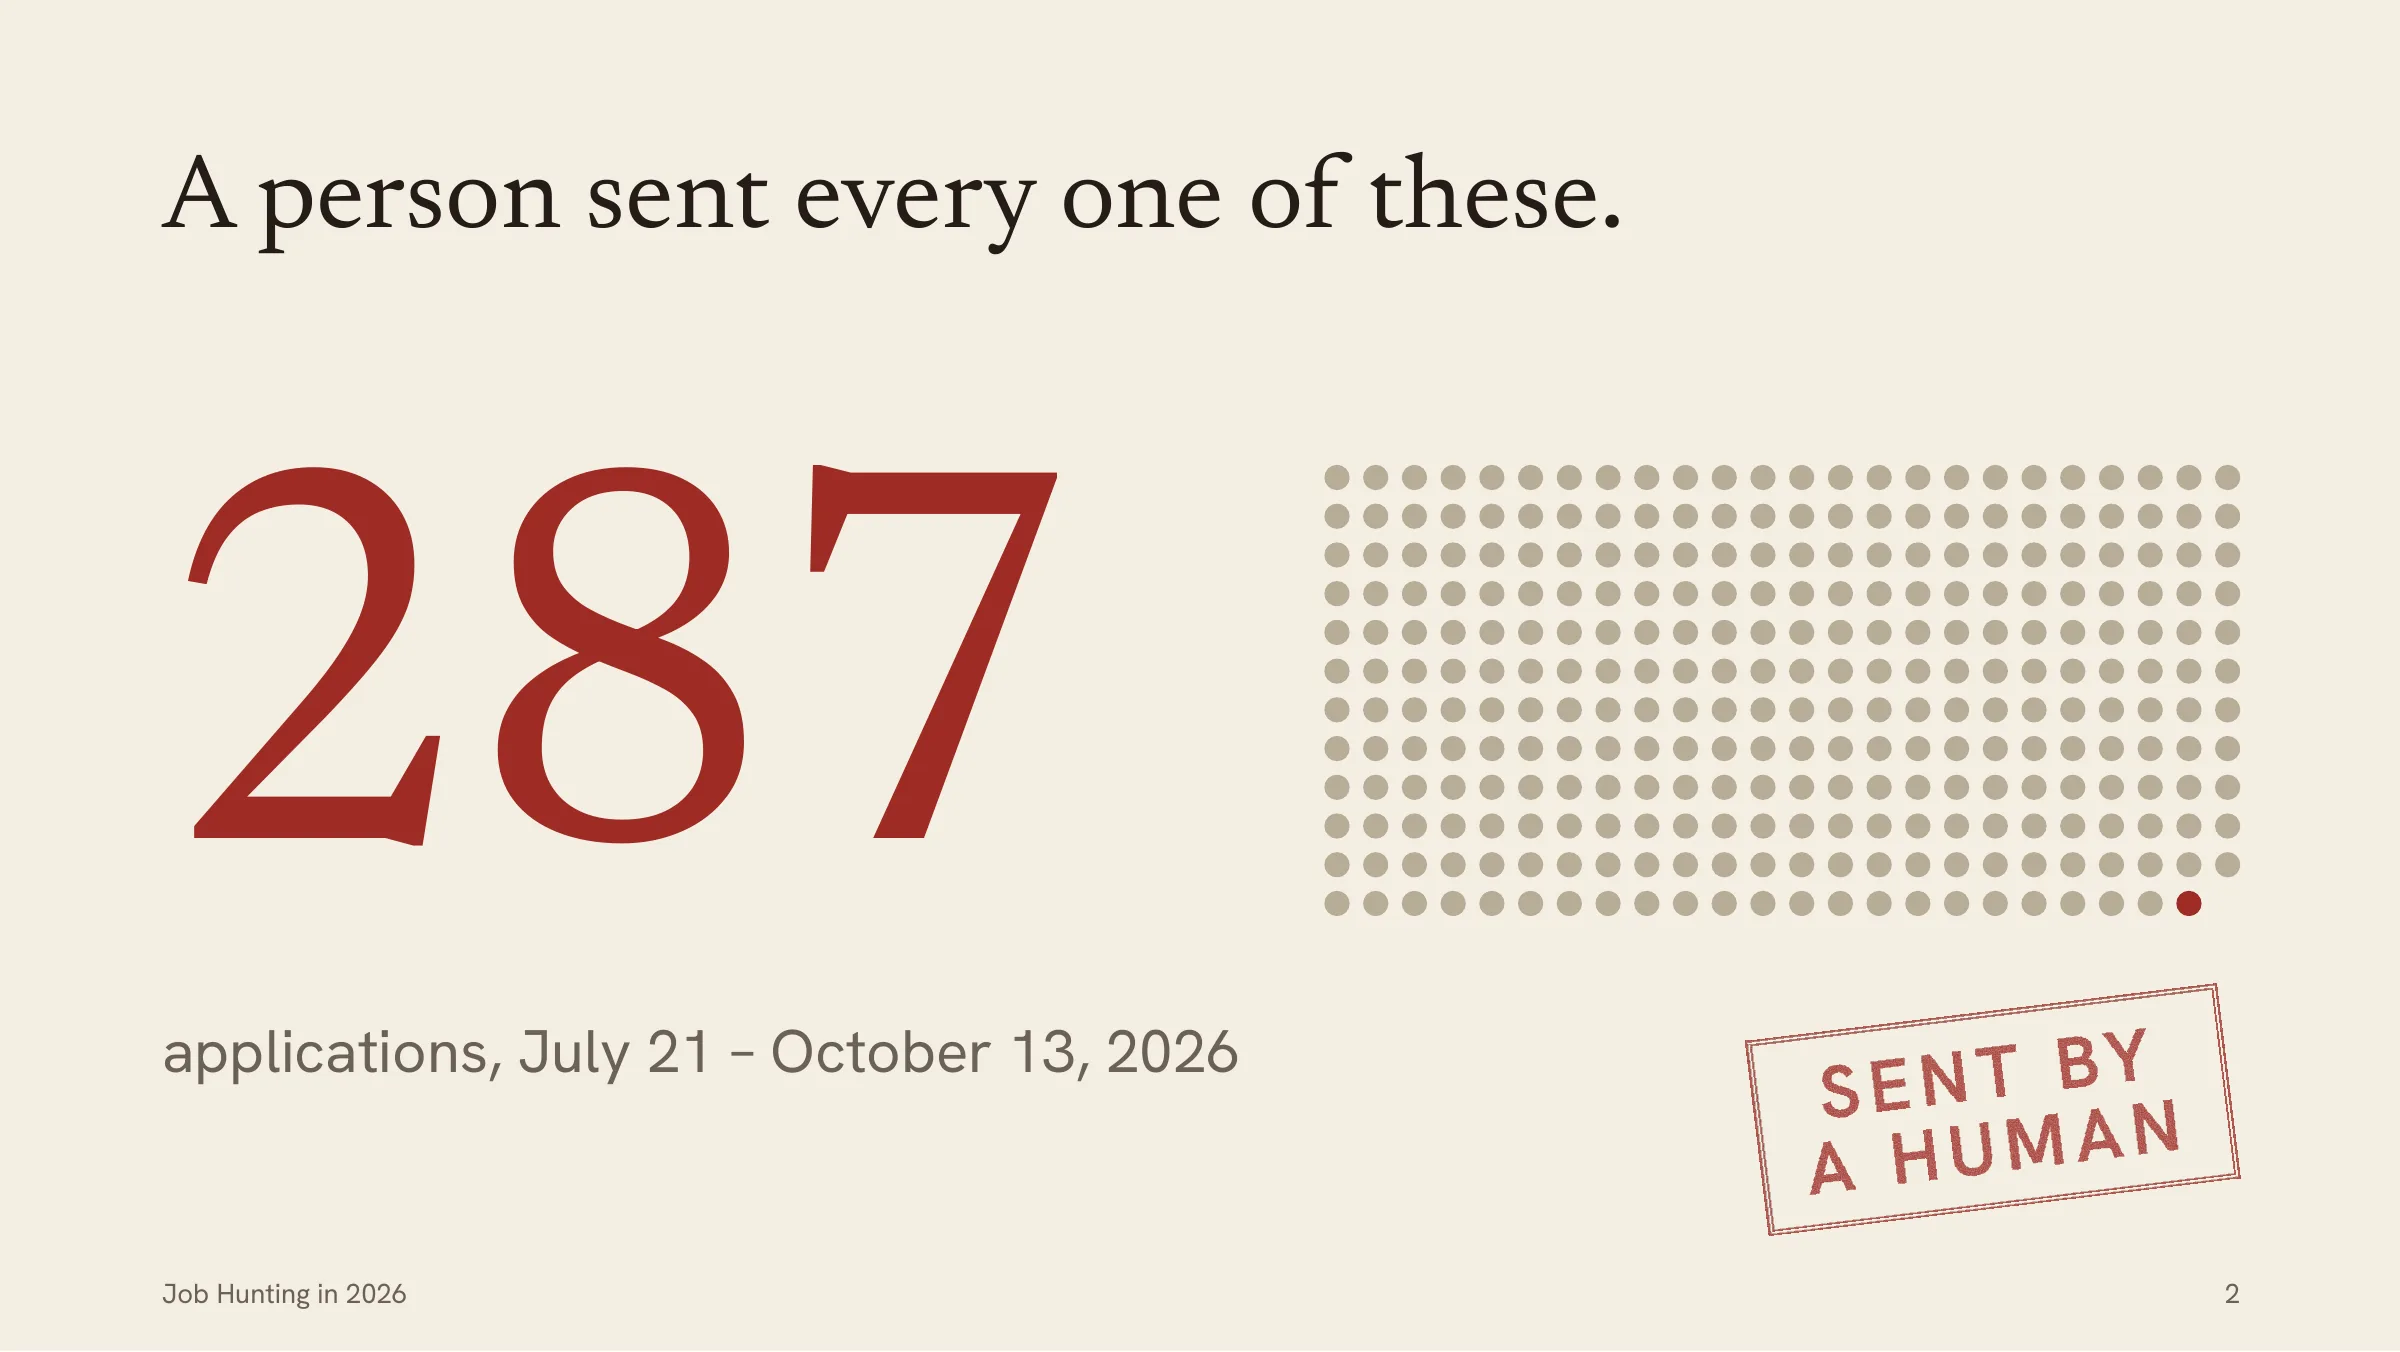
2026I turned 287 logged applications into a report, film and deck: every next step came from a role I’d marked as a strong fit.
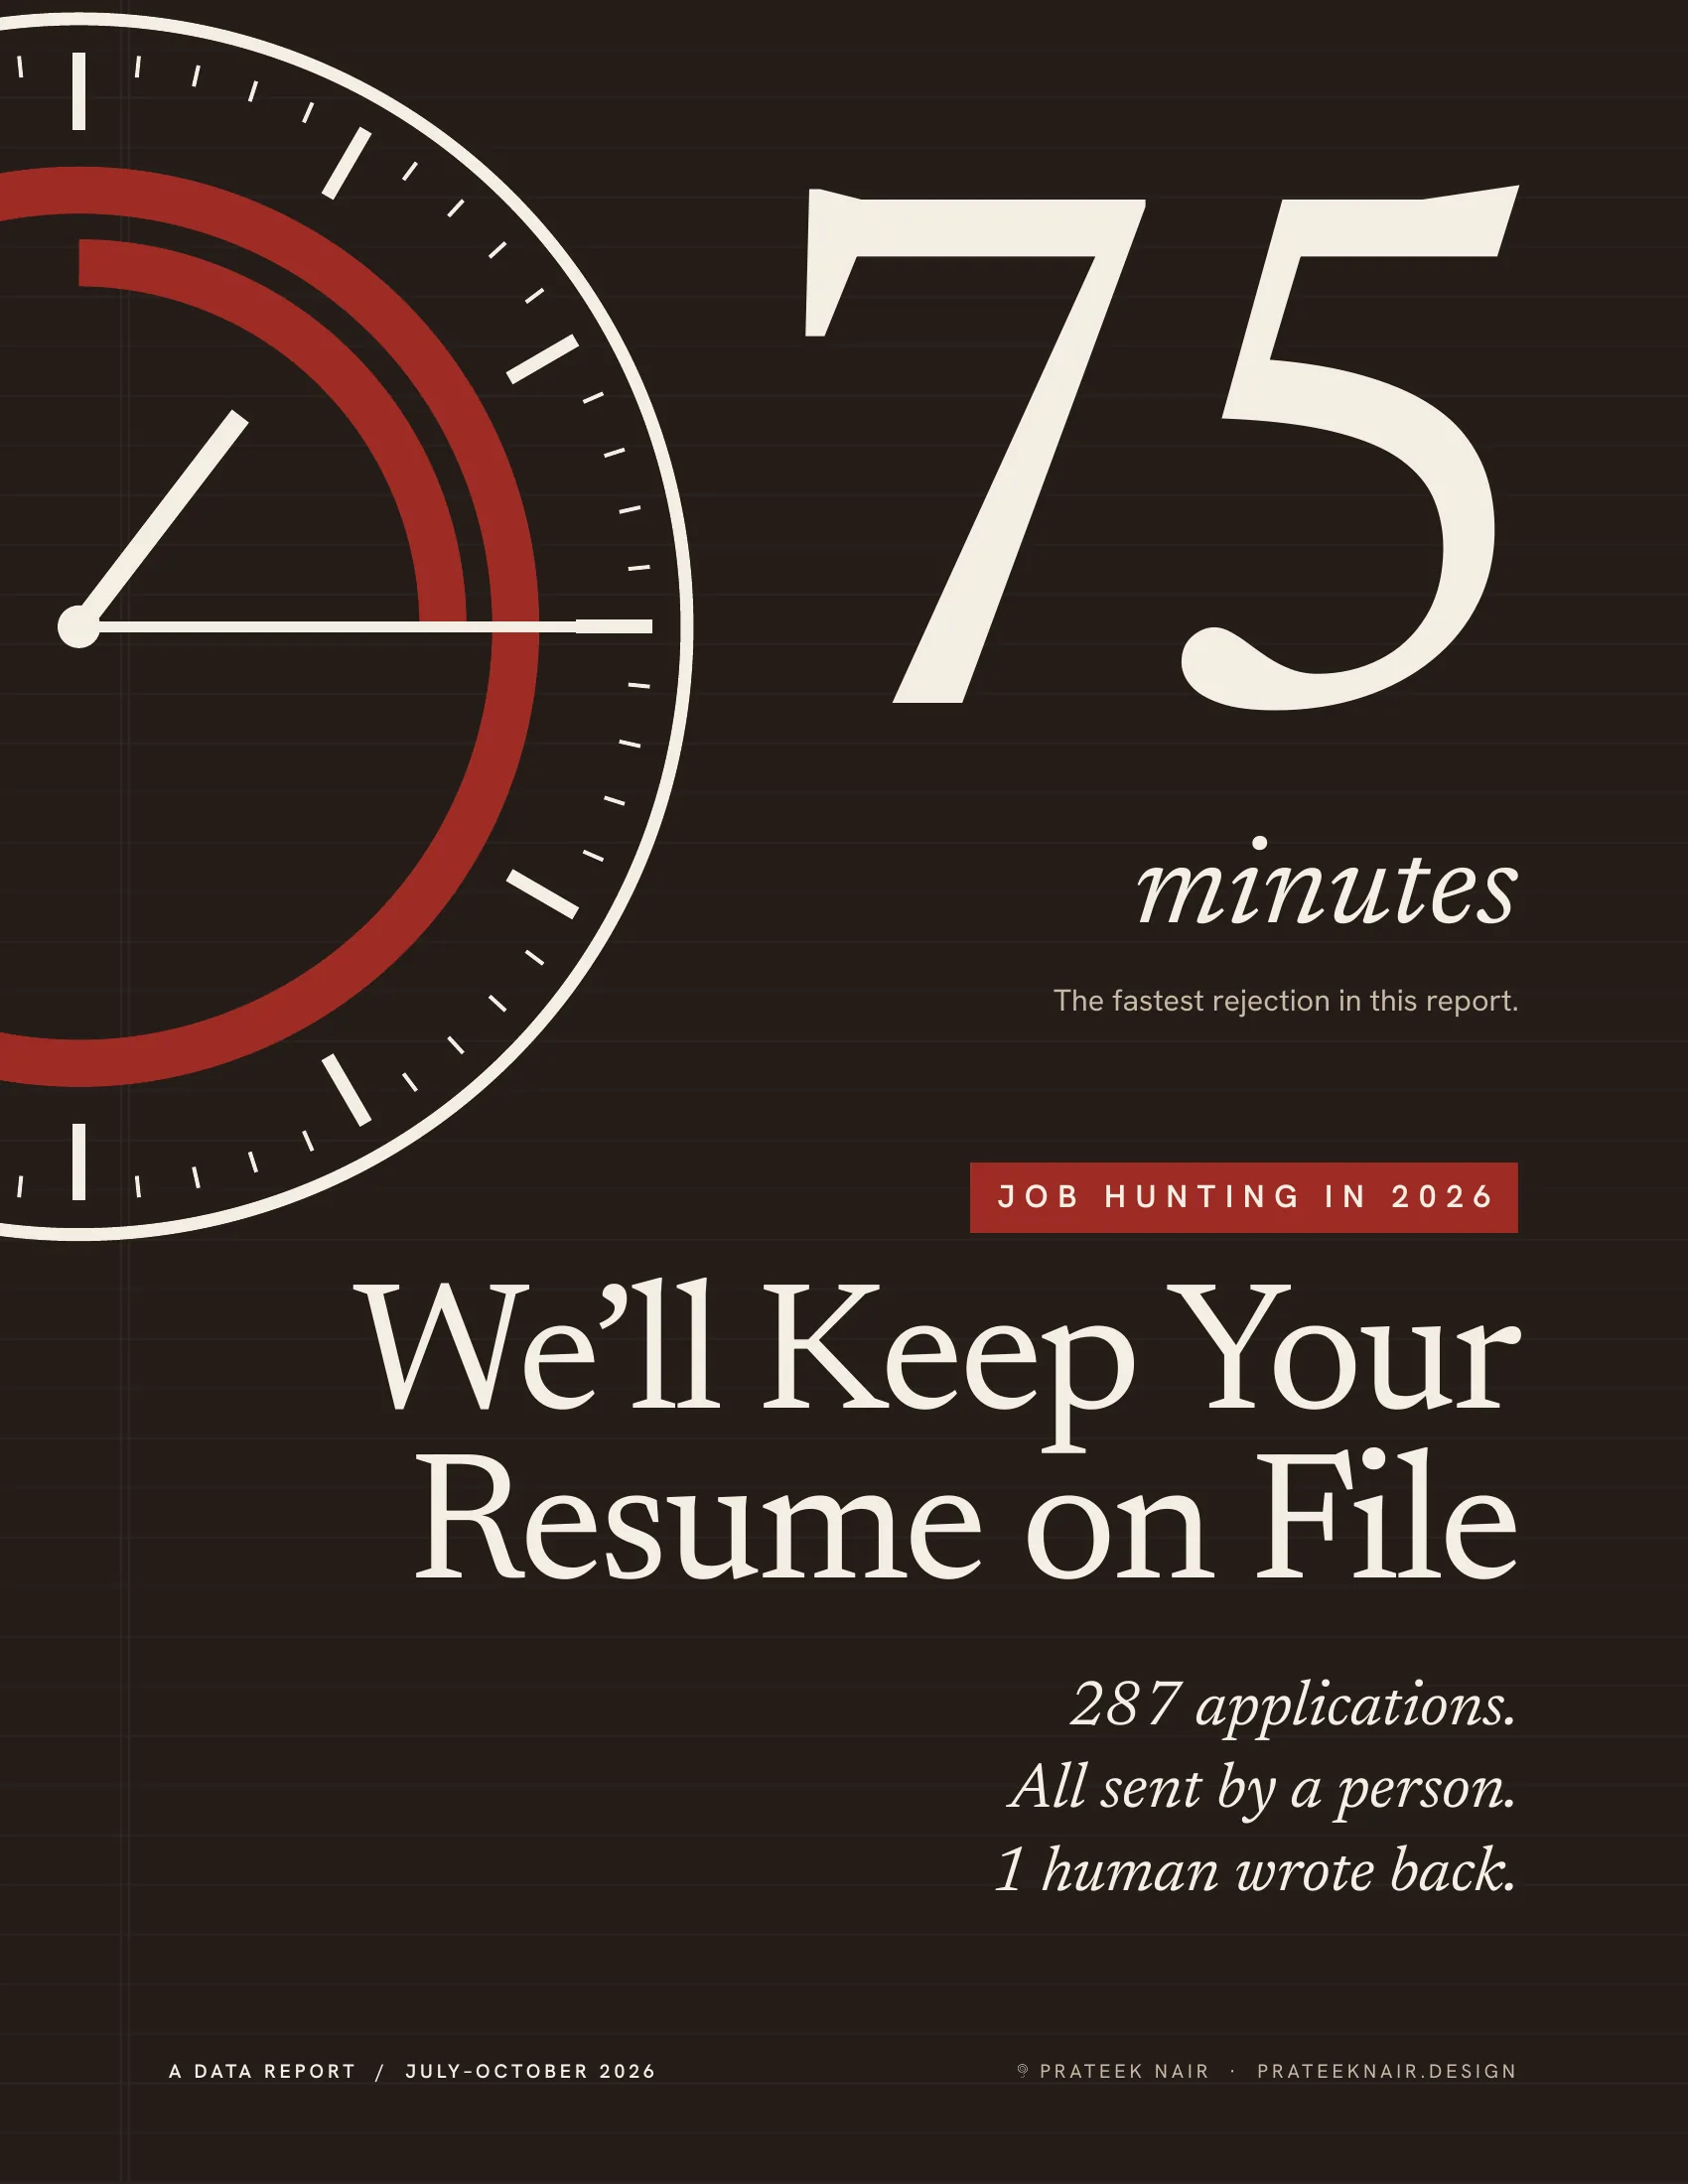
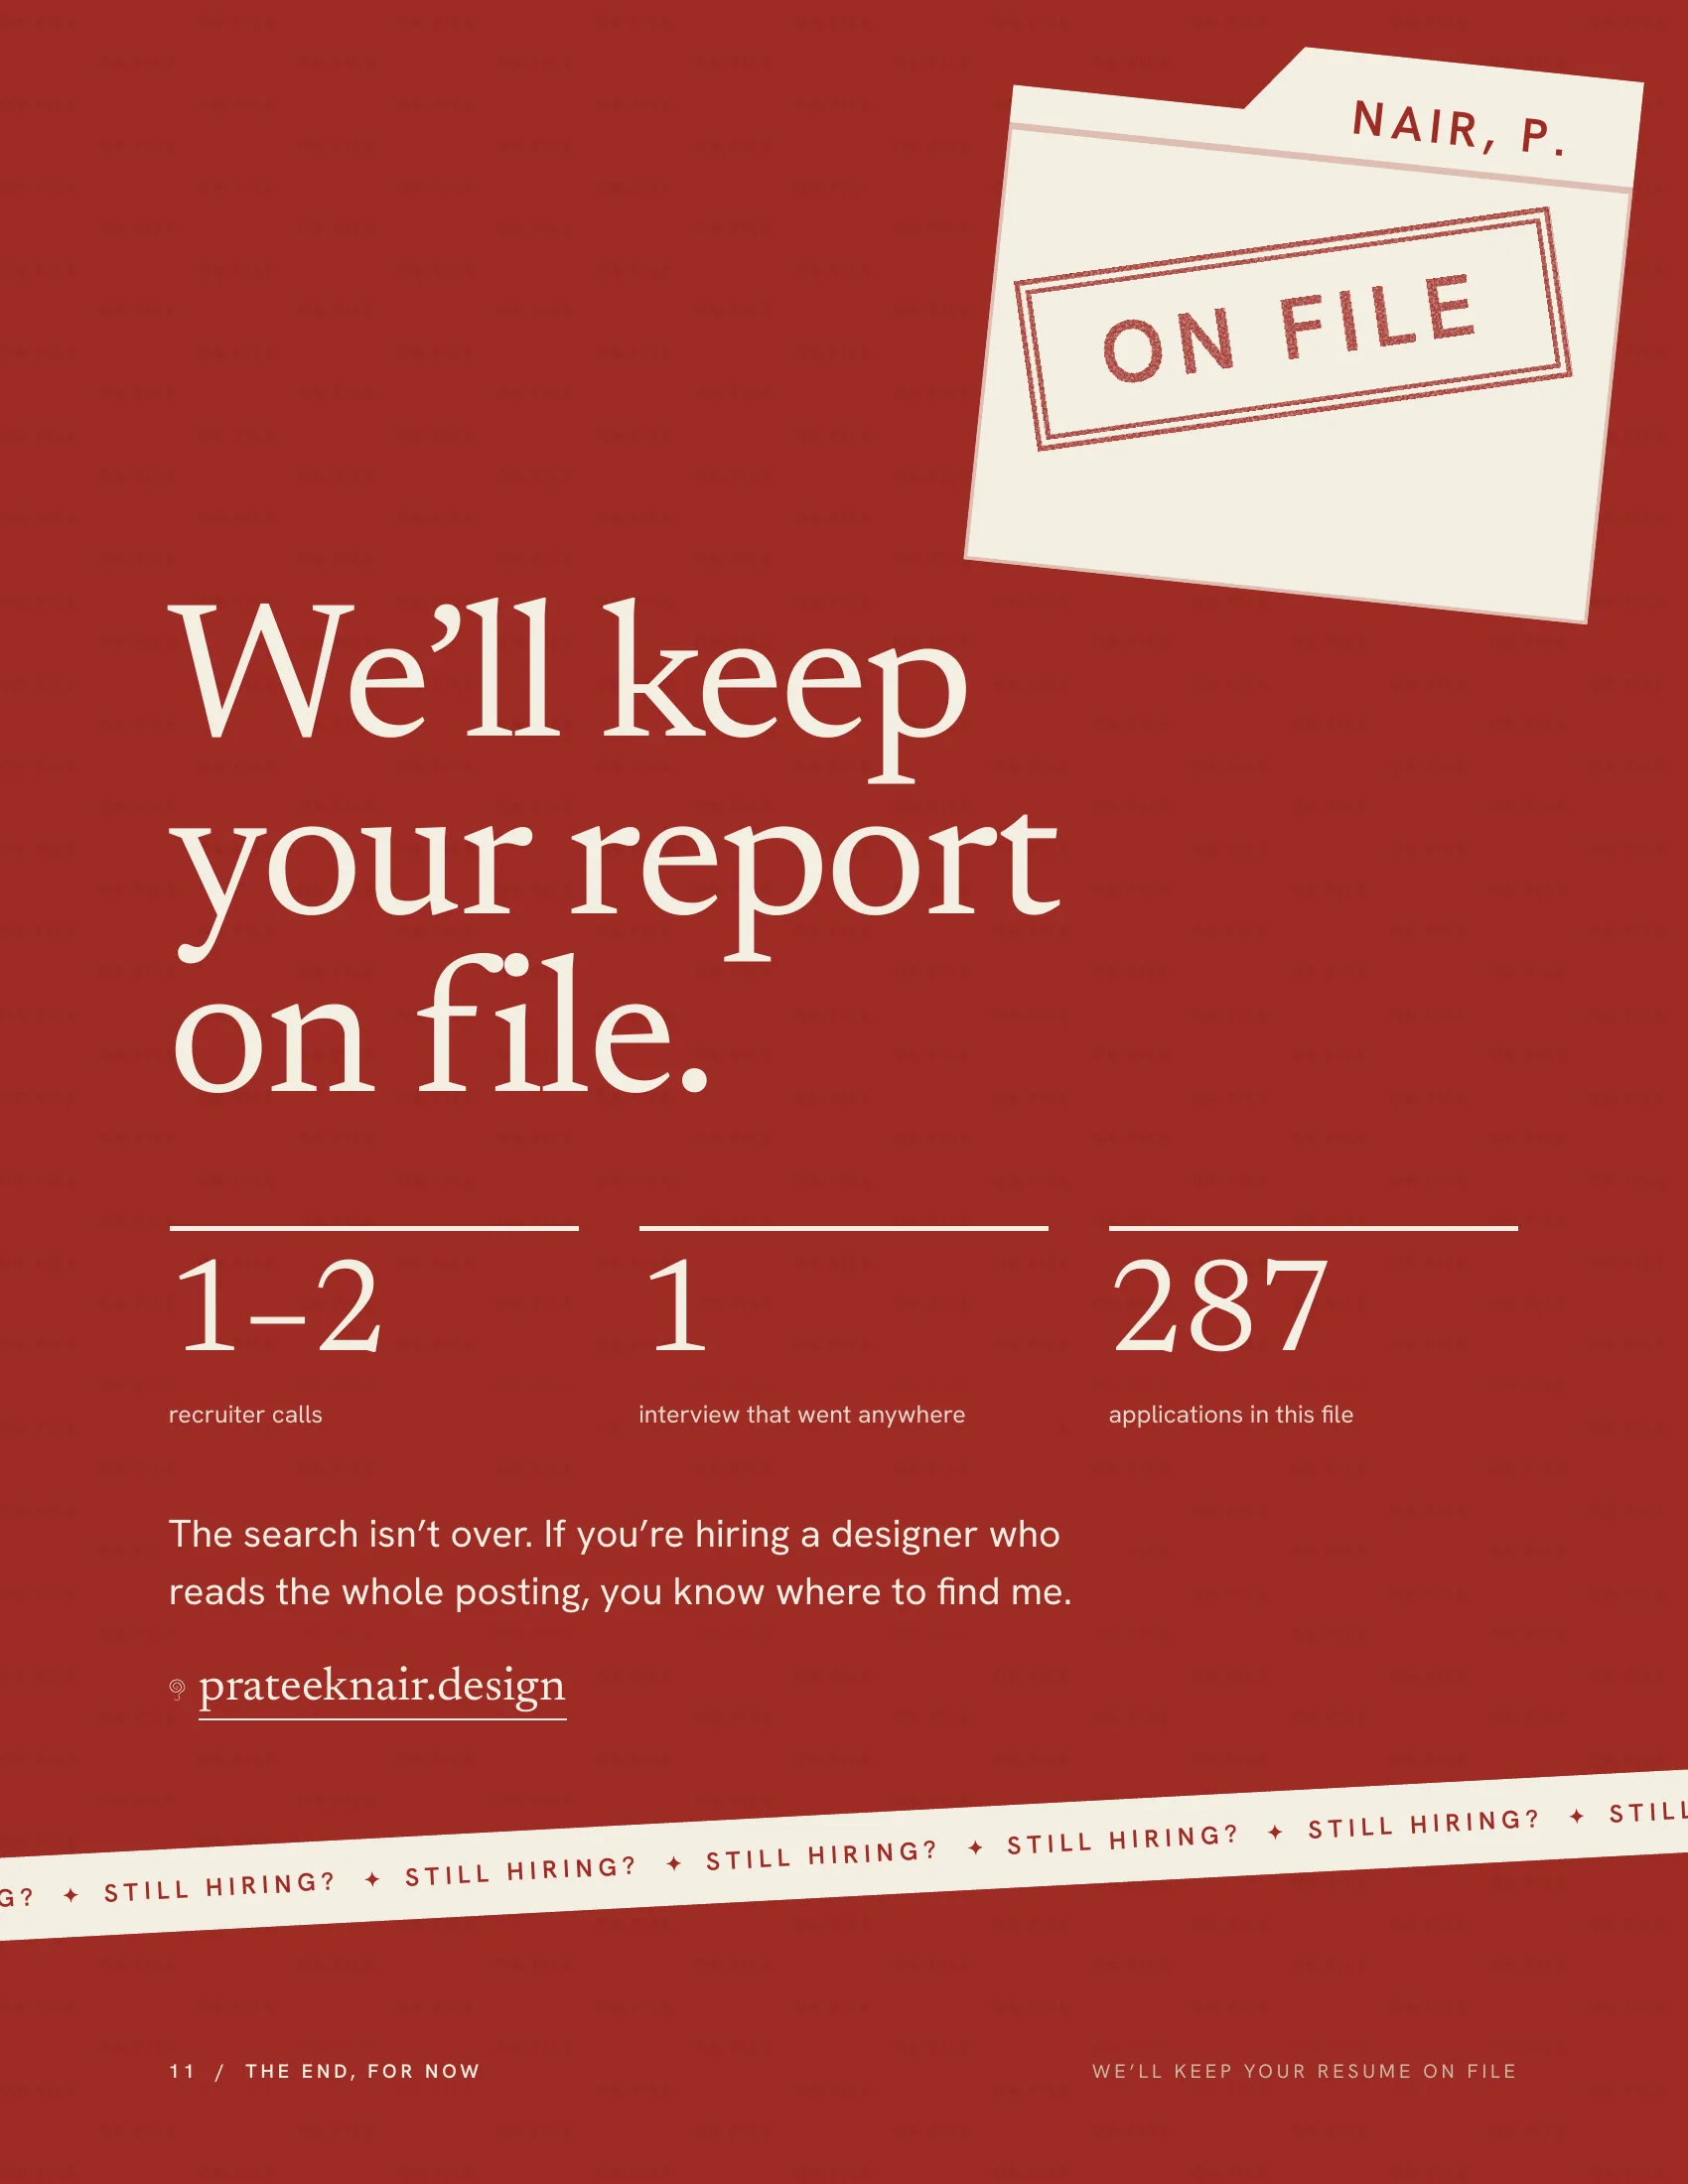
A data report on my own job search. I logged 287 applications from July to October 2026 and turned the tracker into an 11-page report on how hiring actually responds: how fast the no’s arrive, who never answers, and what moved forward. The clearest finding: every application that reached a next step came from a role I’d marked as a strong fit.
Why I made it
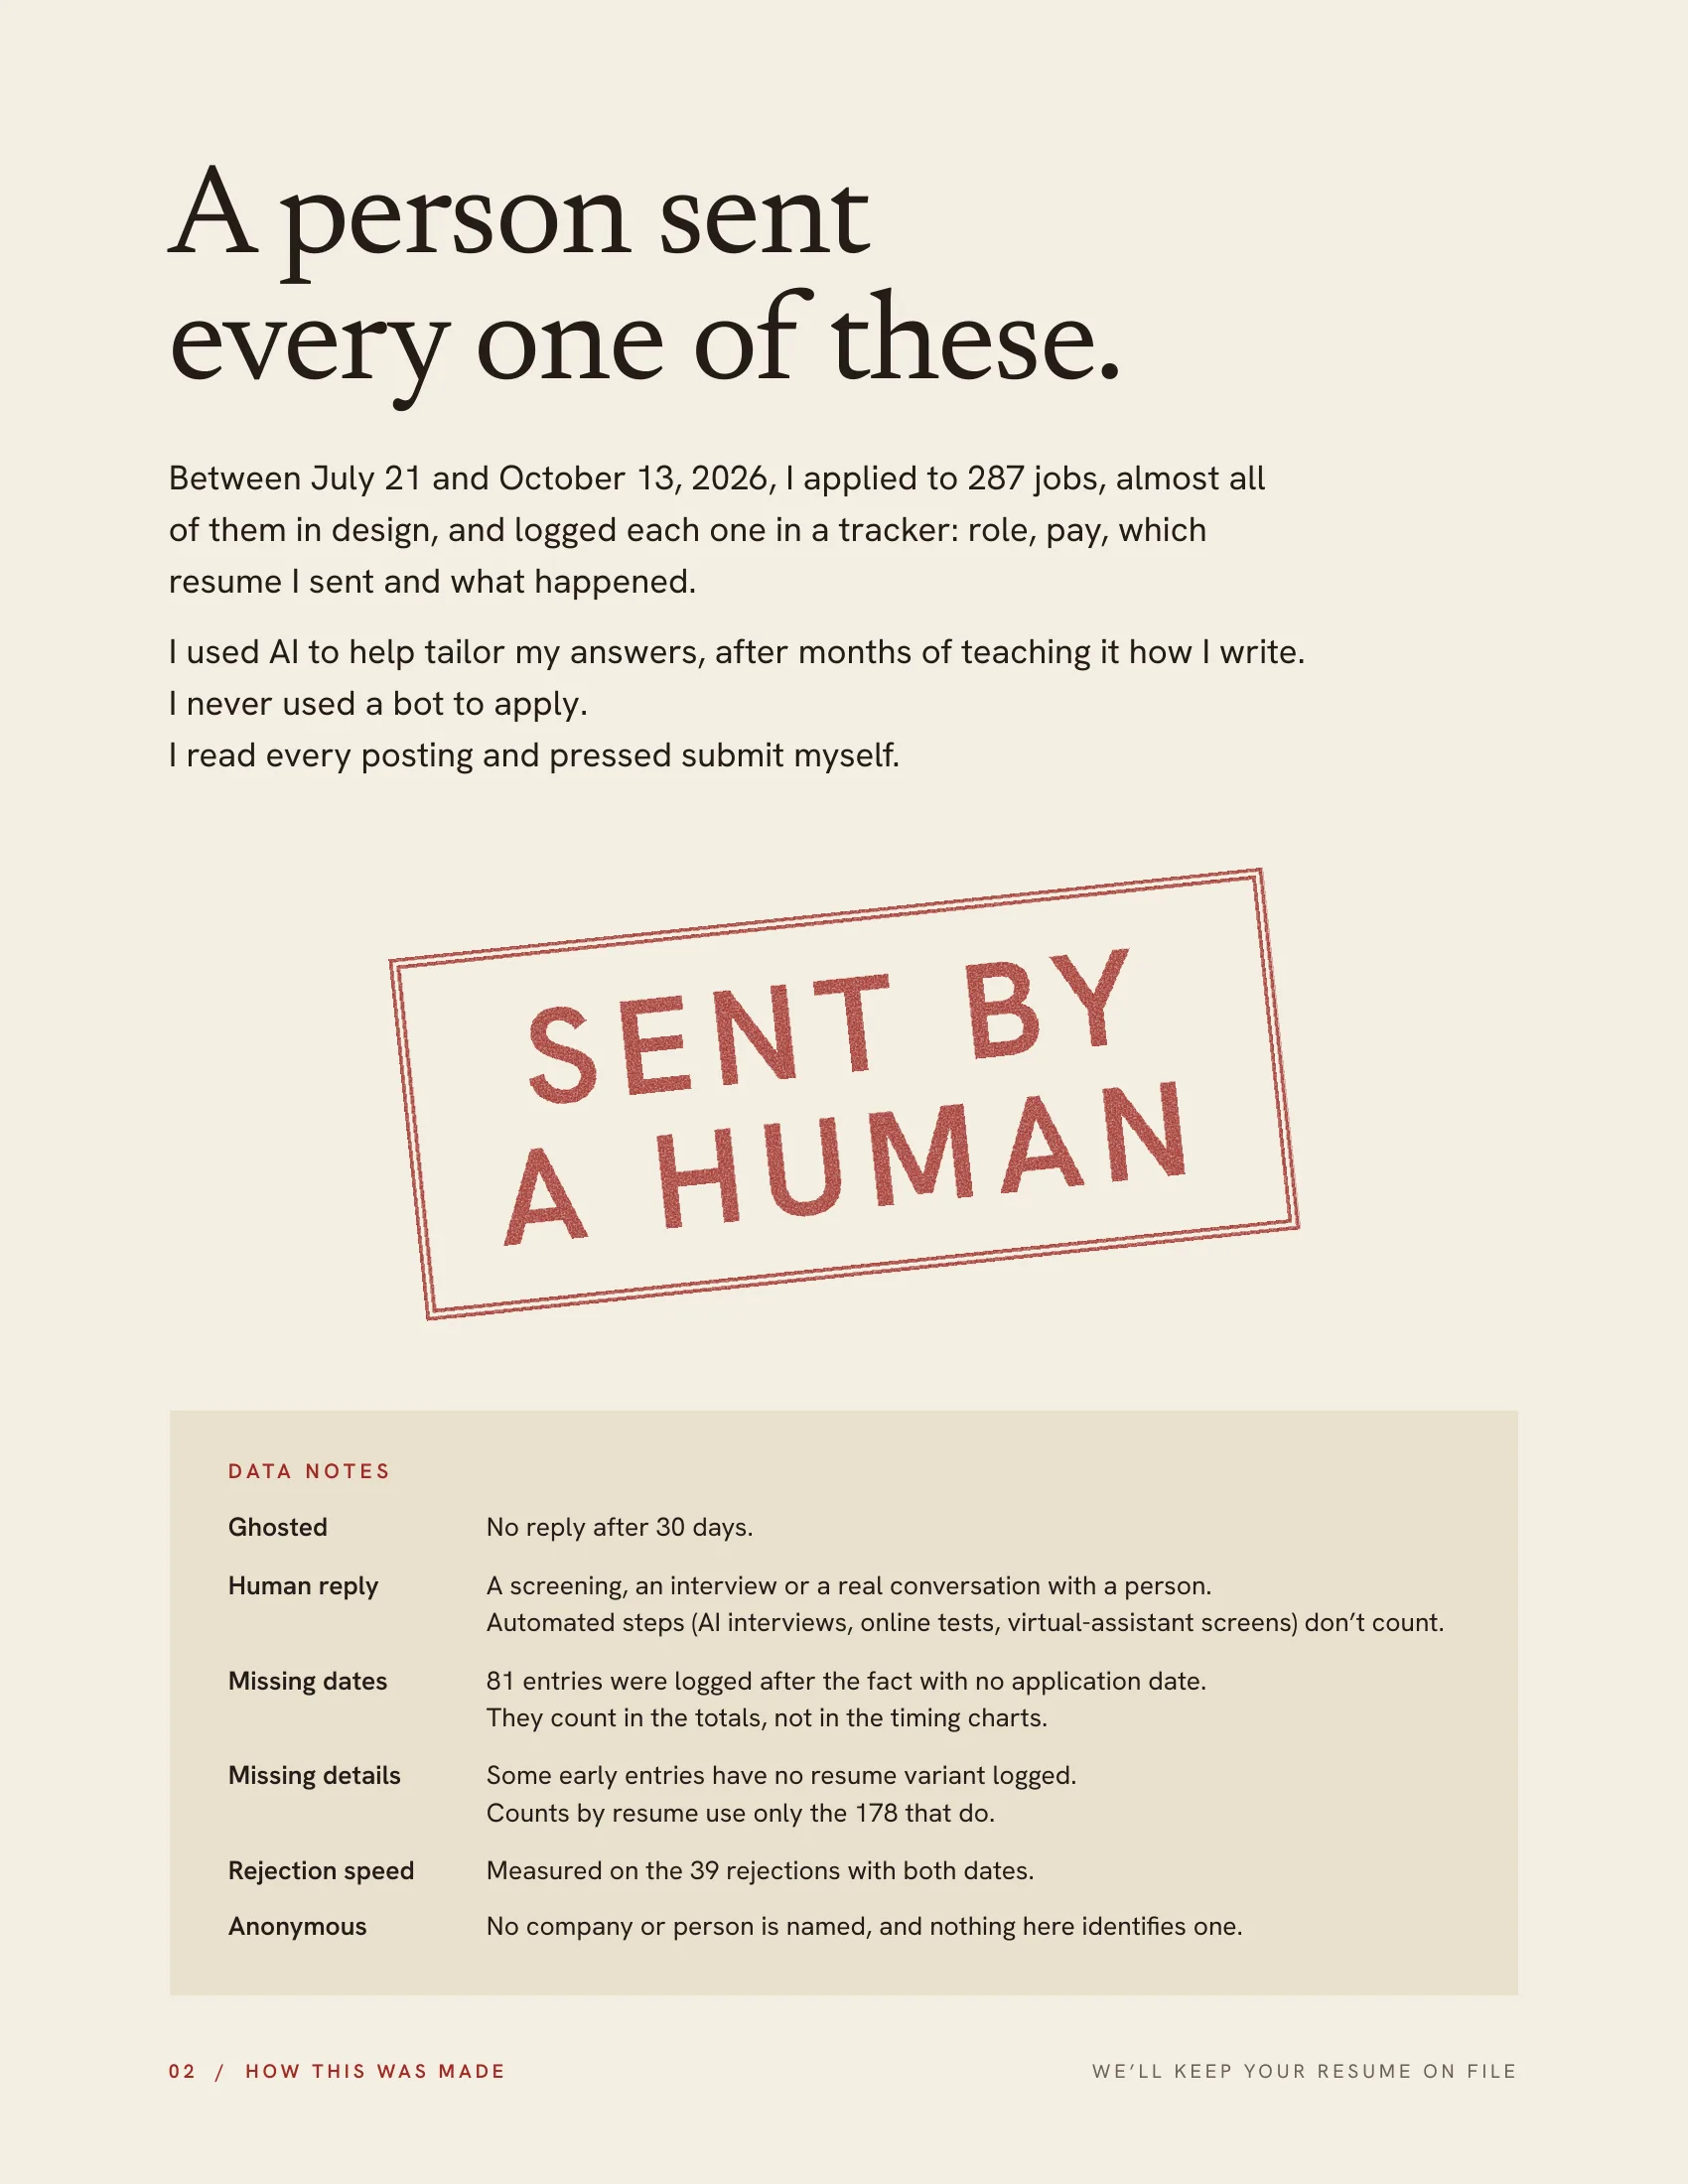
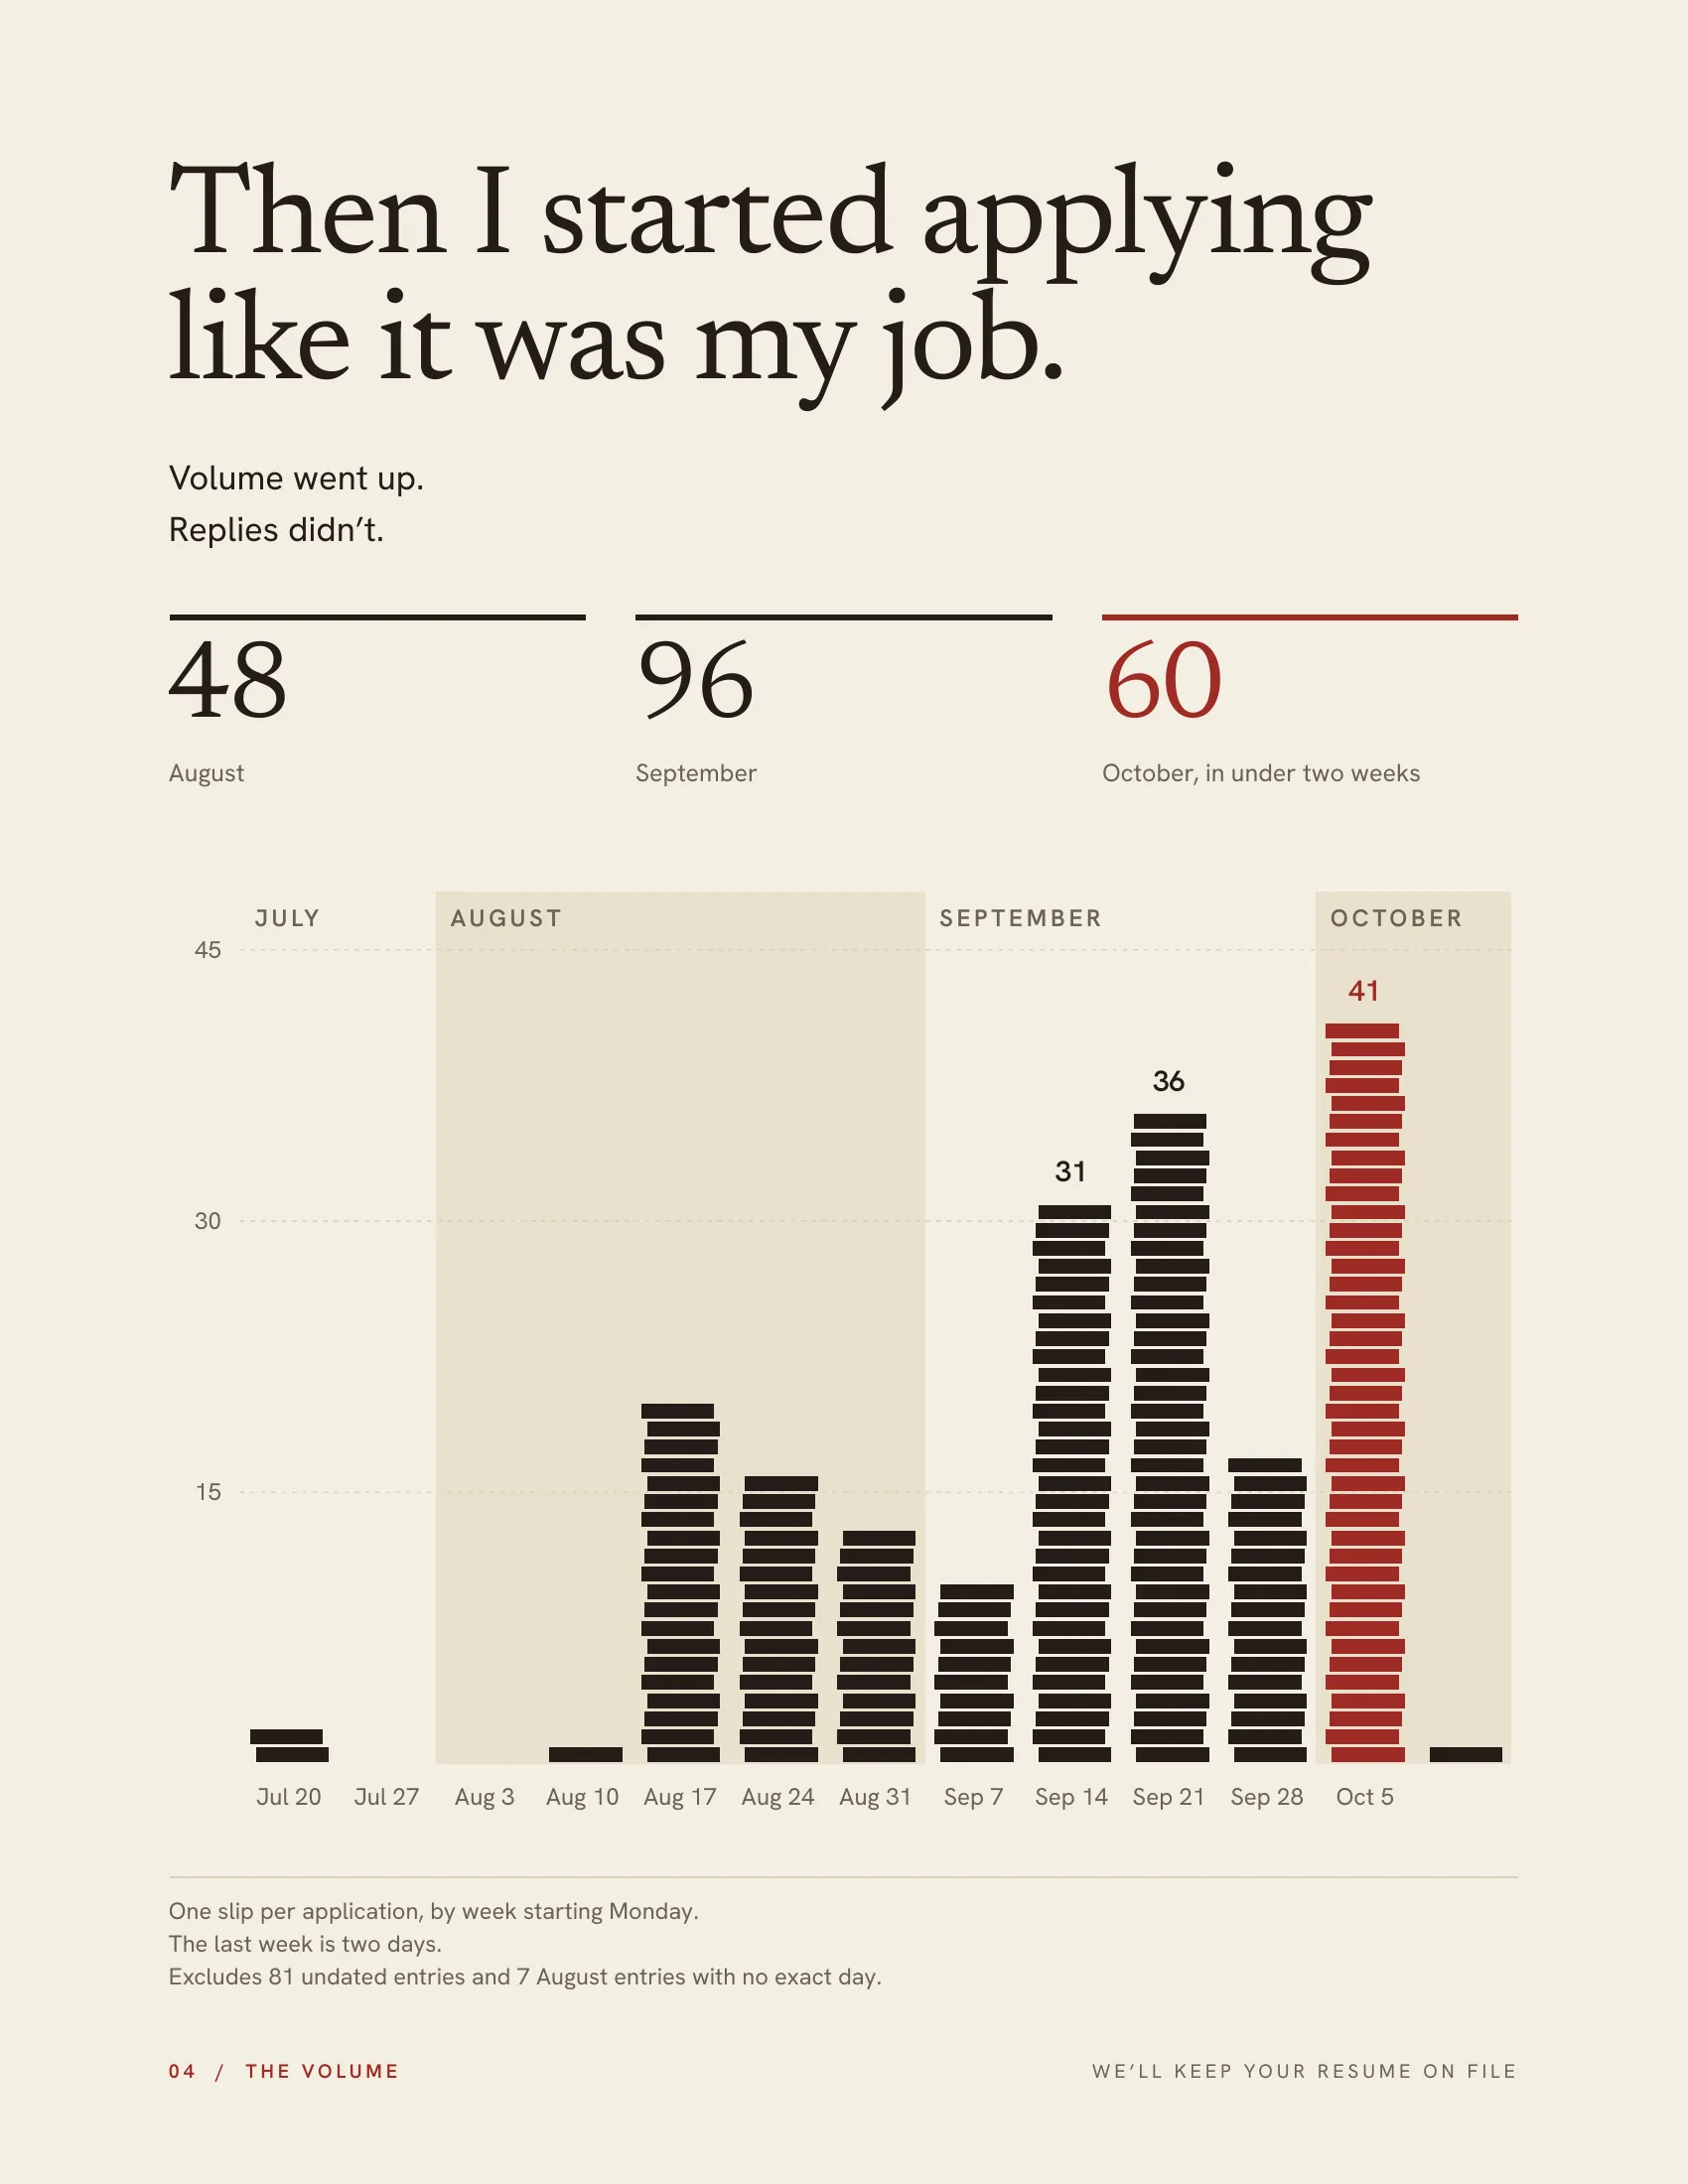
I was applying to design jobs full time and logging every one: role, date, pay, which resume I sent and what happened. By October the tracker had 287 rows and almost no answers. I wanted to know if the silence had a shape.
Rules before charts
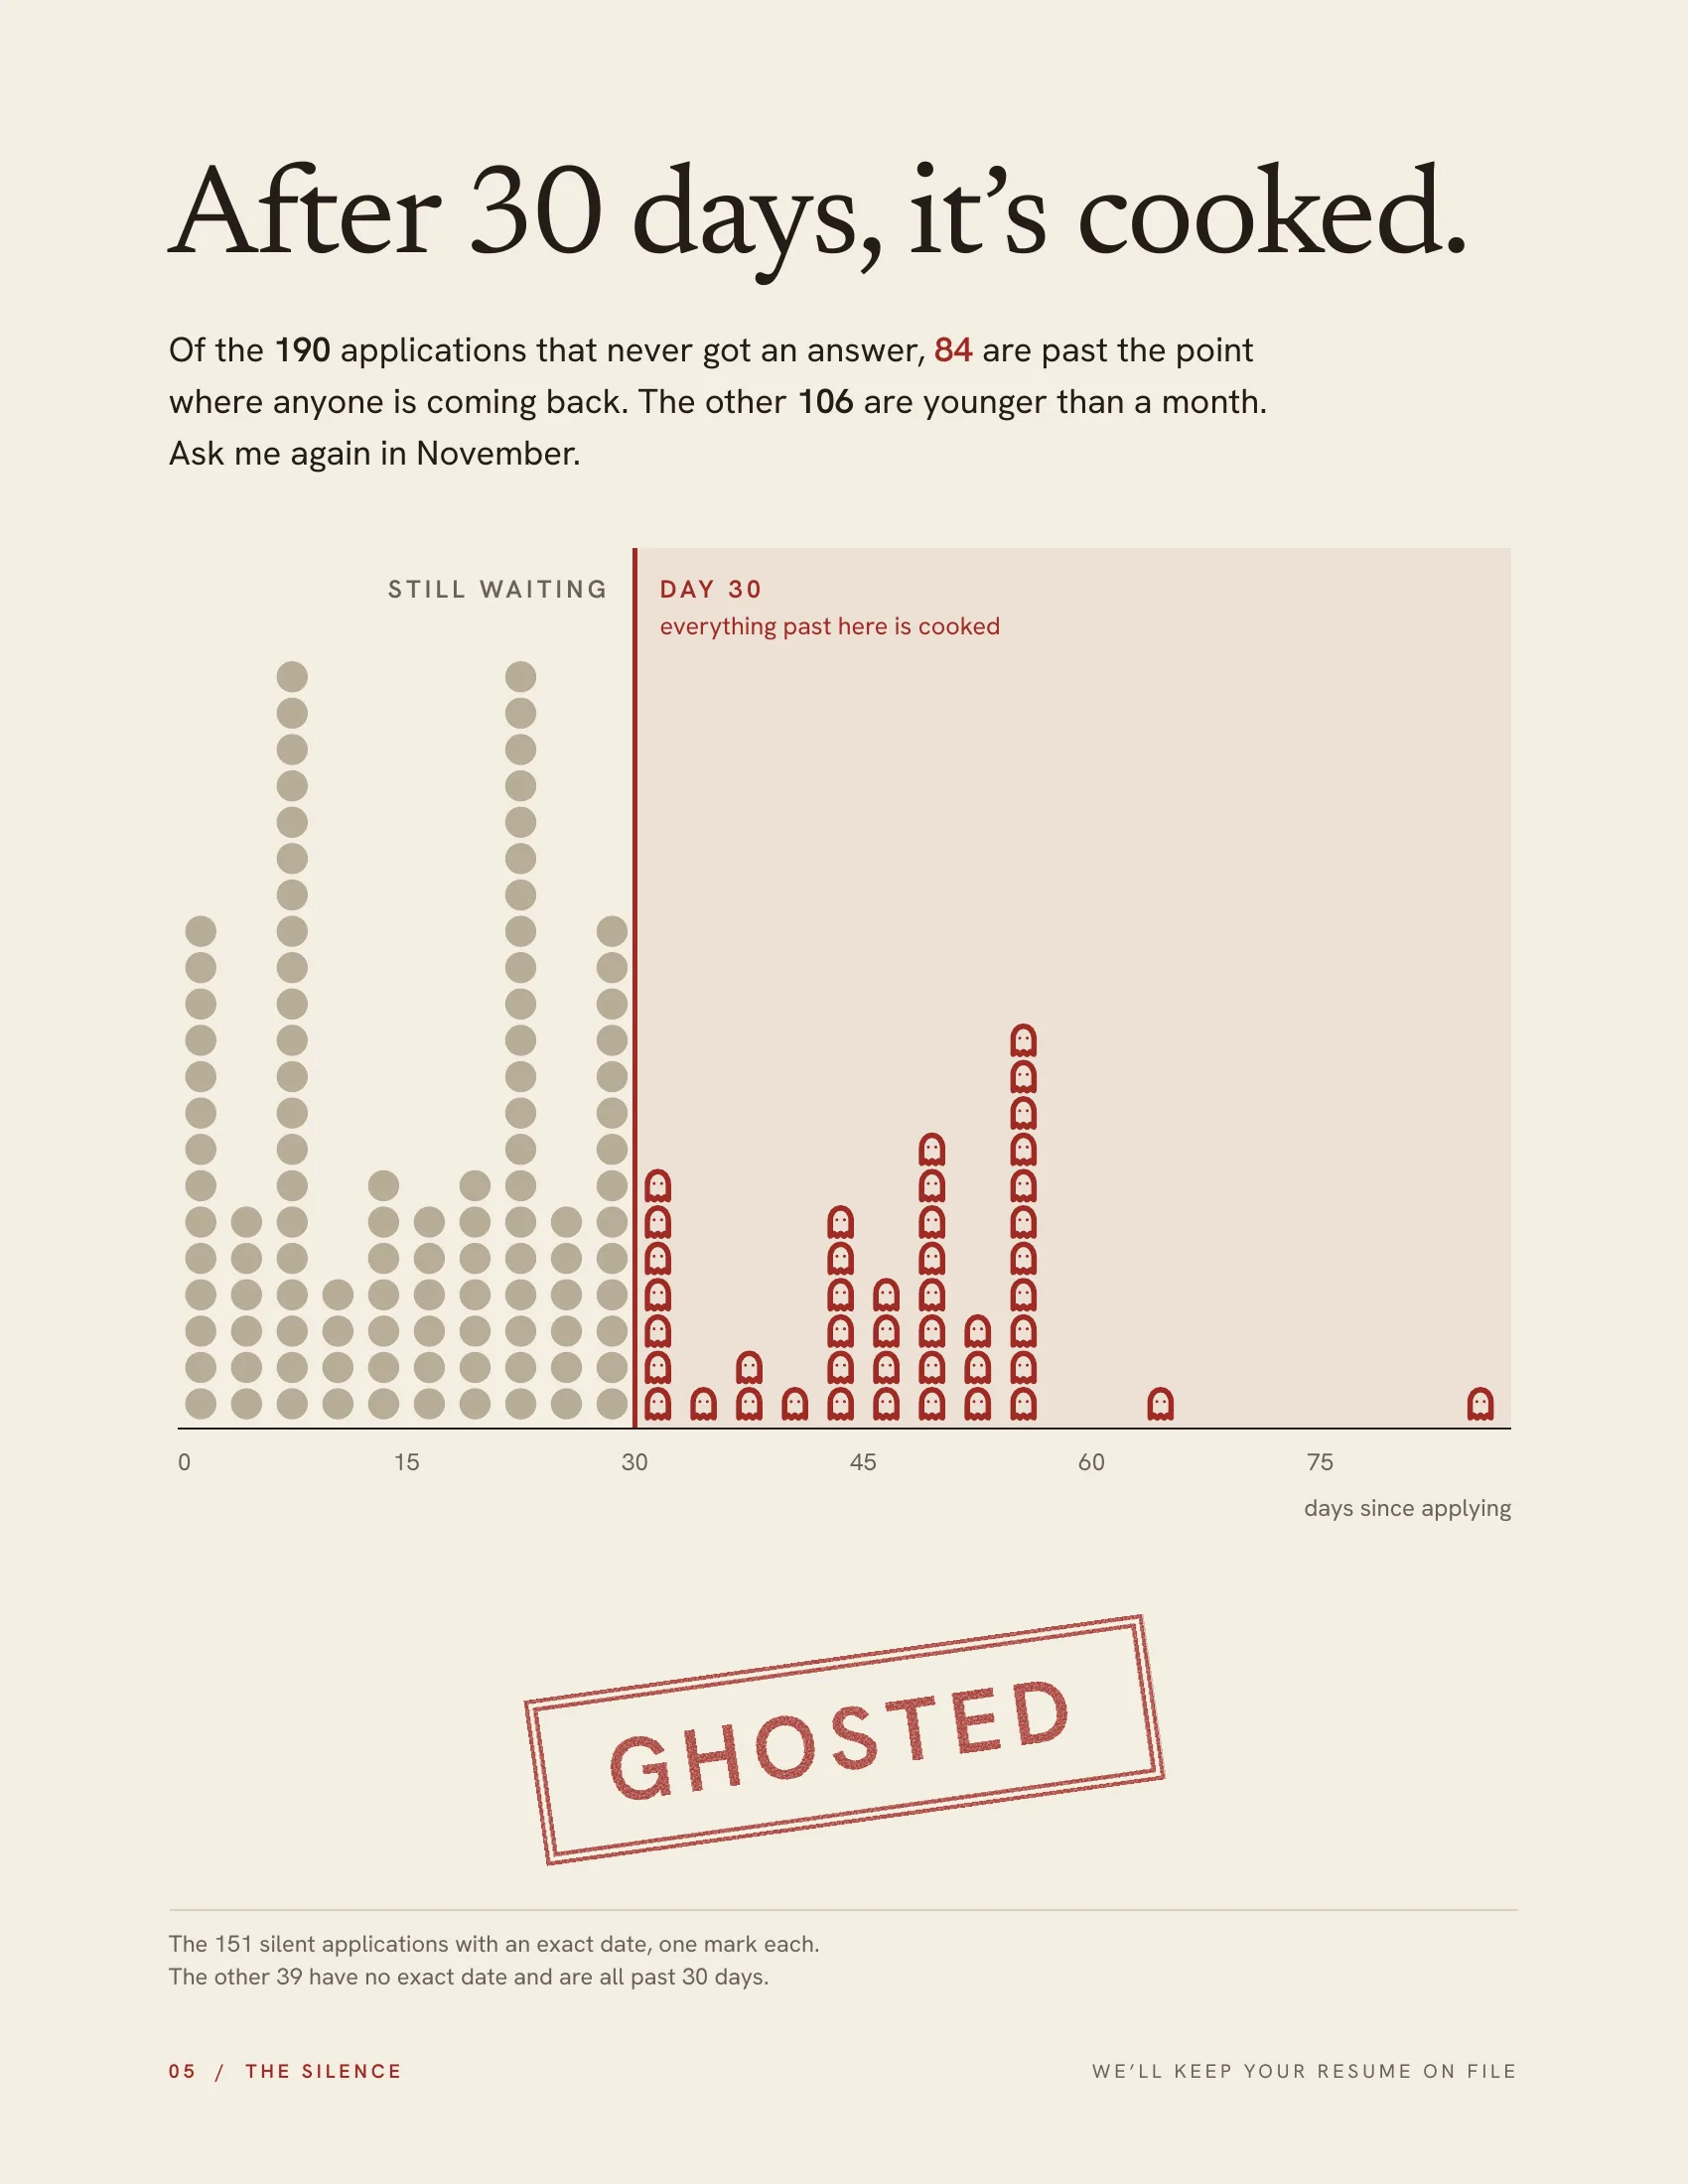
I set the definitions before drawing anything. Ghosted means no reply after 30 days. A human reply is a screening, an interview or a real conversation with a person; AI interviews, online tests and virtual-assistant screens don’t count. Undated entries count in the totals, never in the timing charts. No company or person is named.
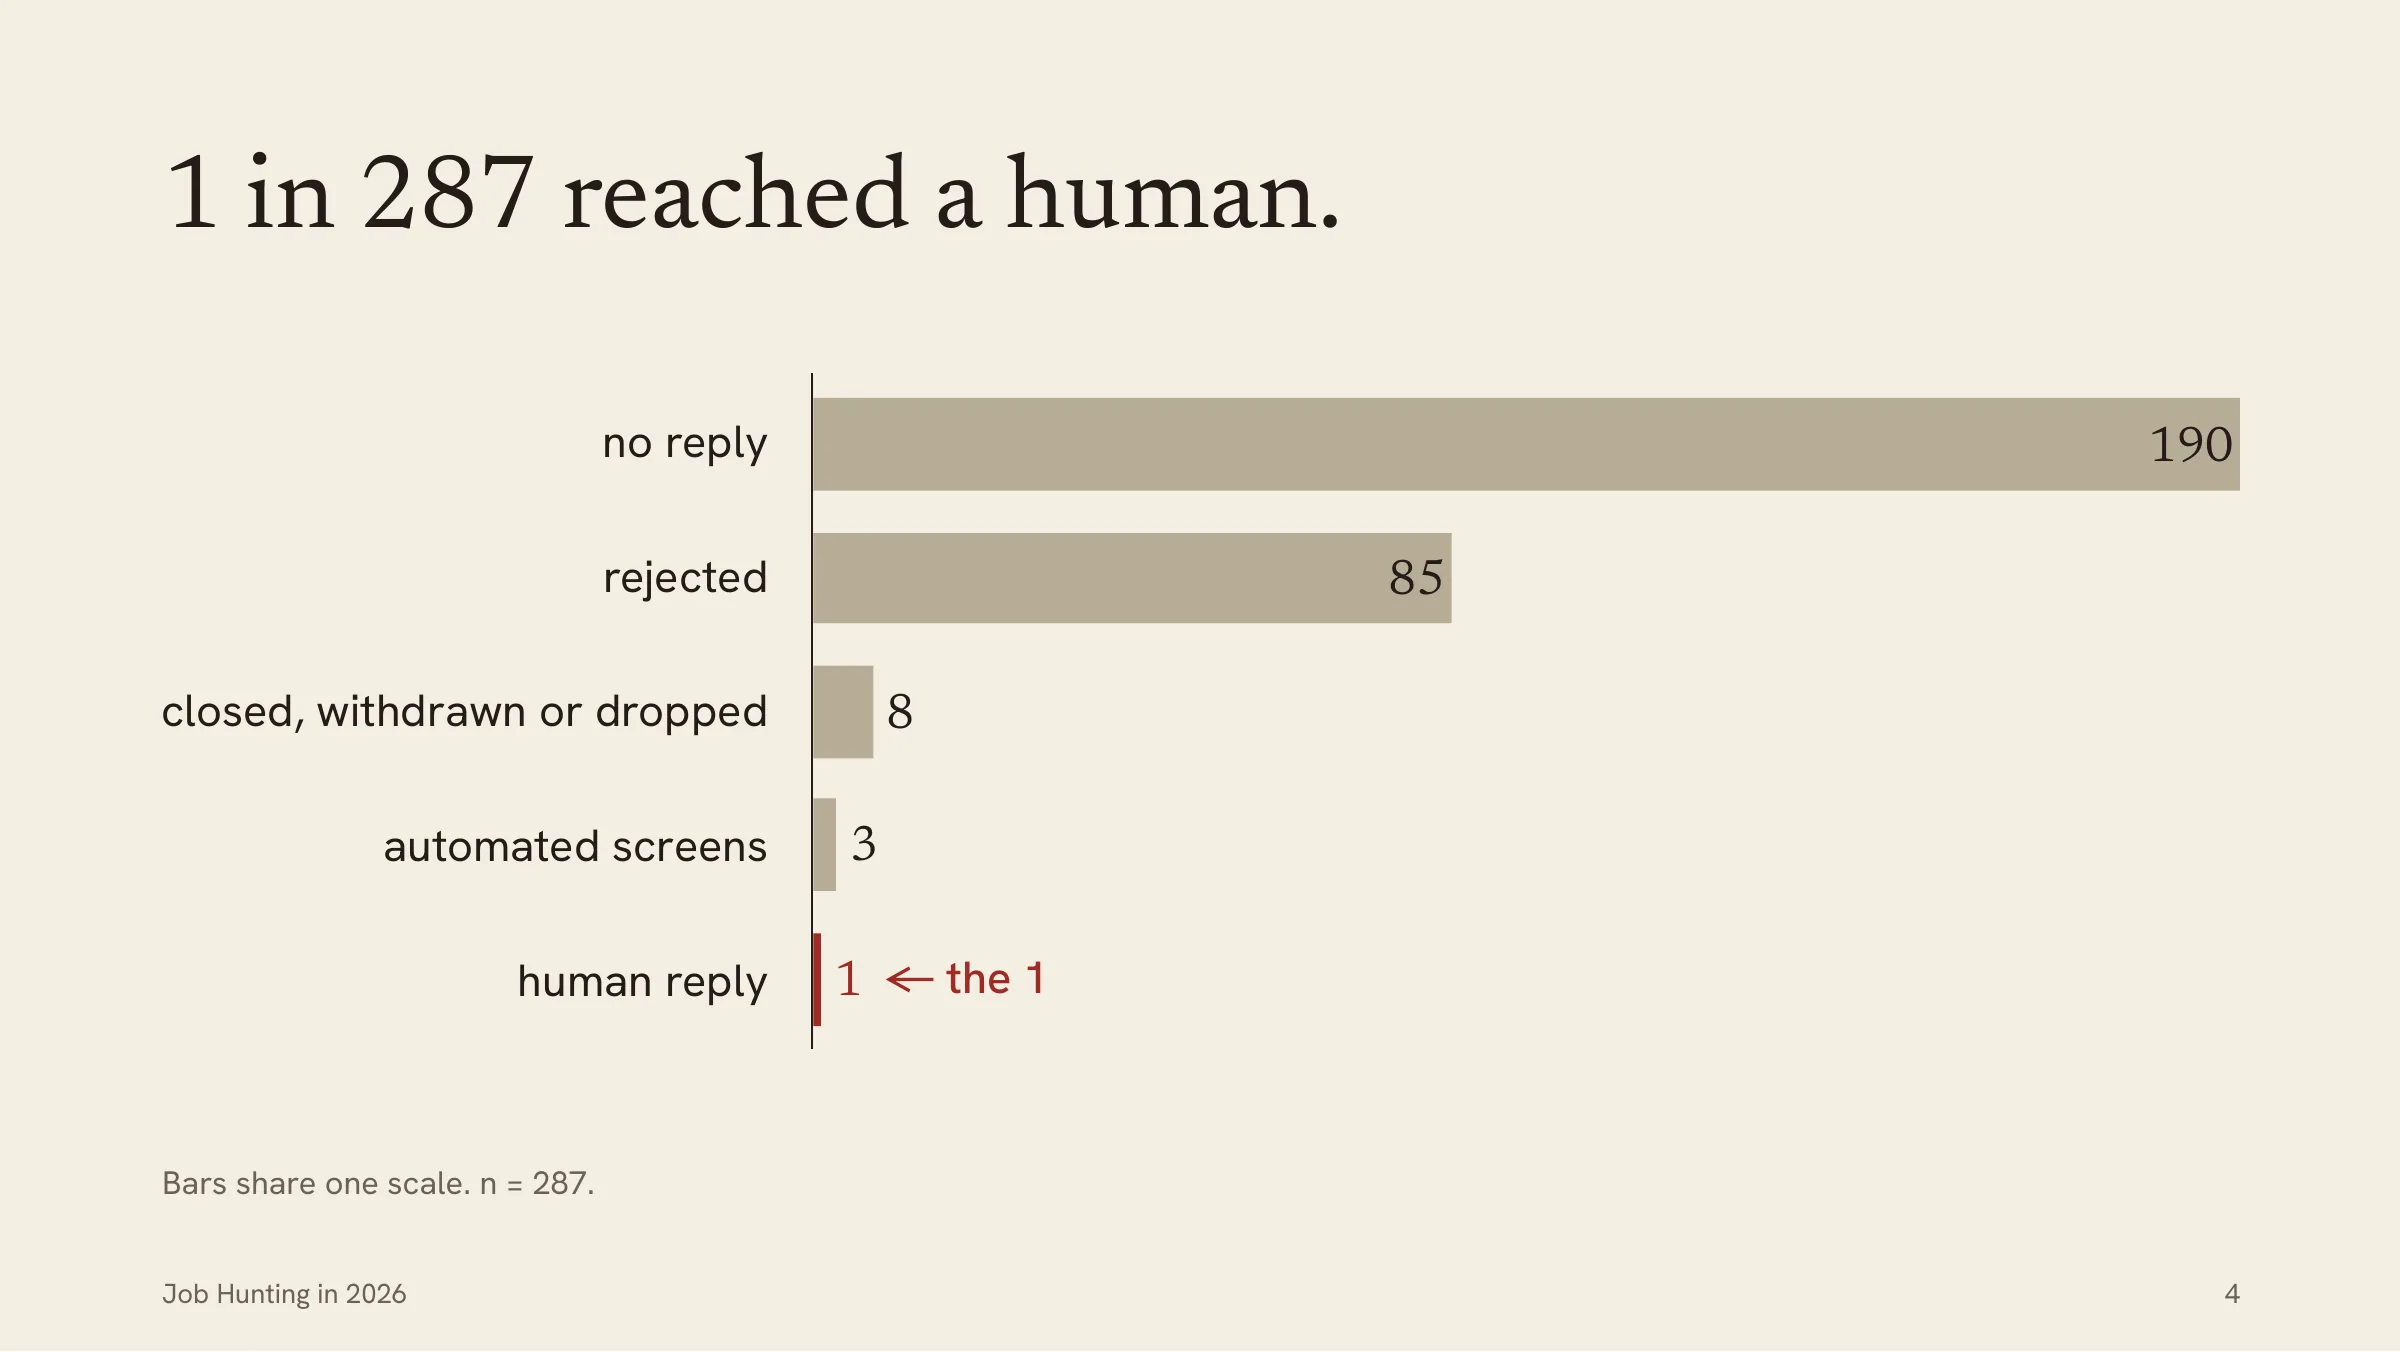
The rules changed the story. My first count of human replies was four. Under my own definition, it’s one.
What the data says
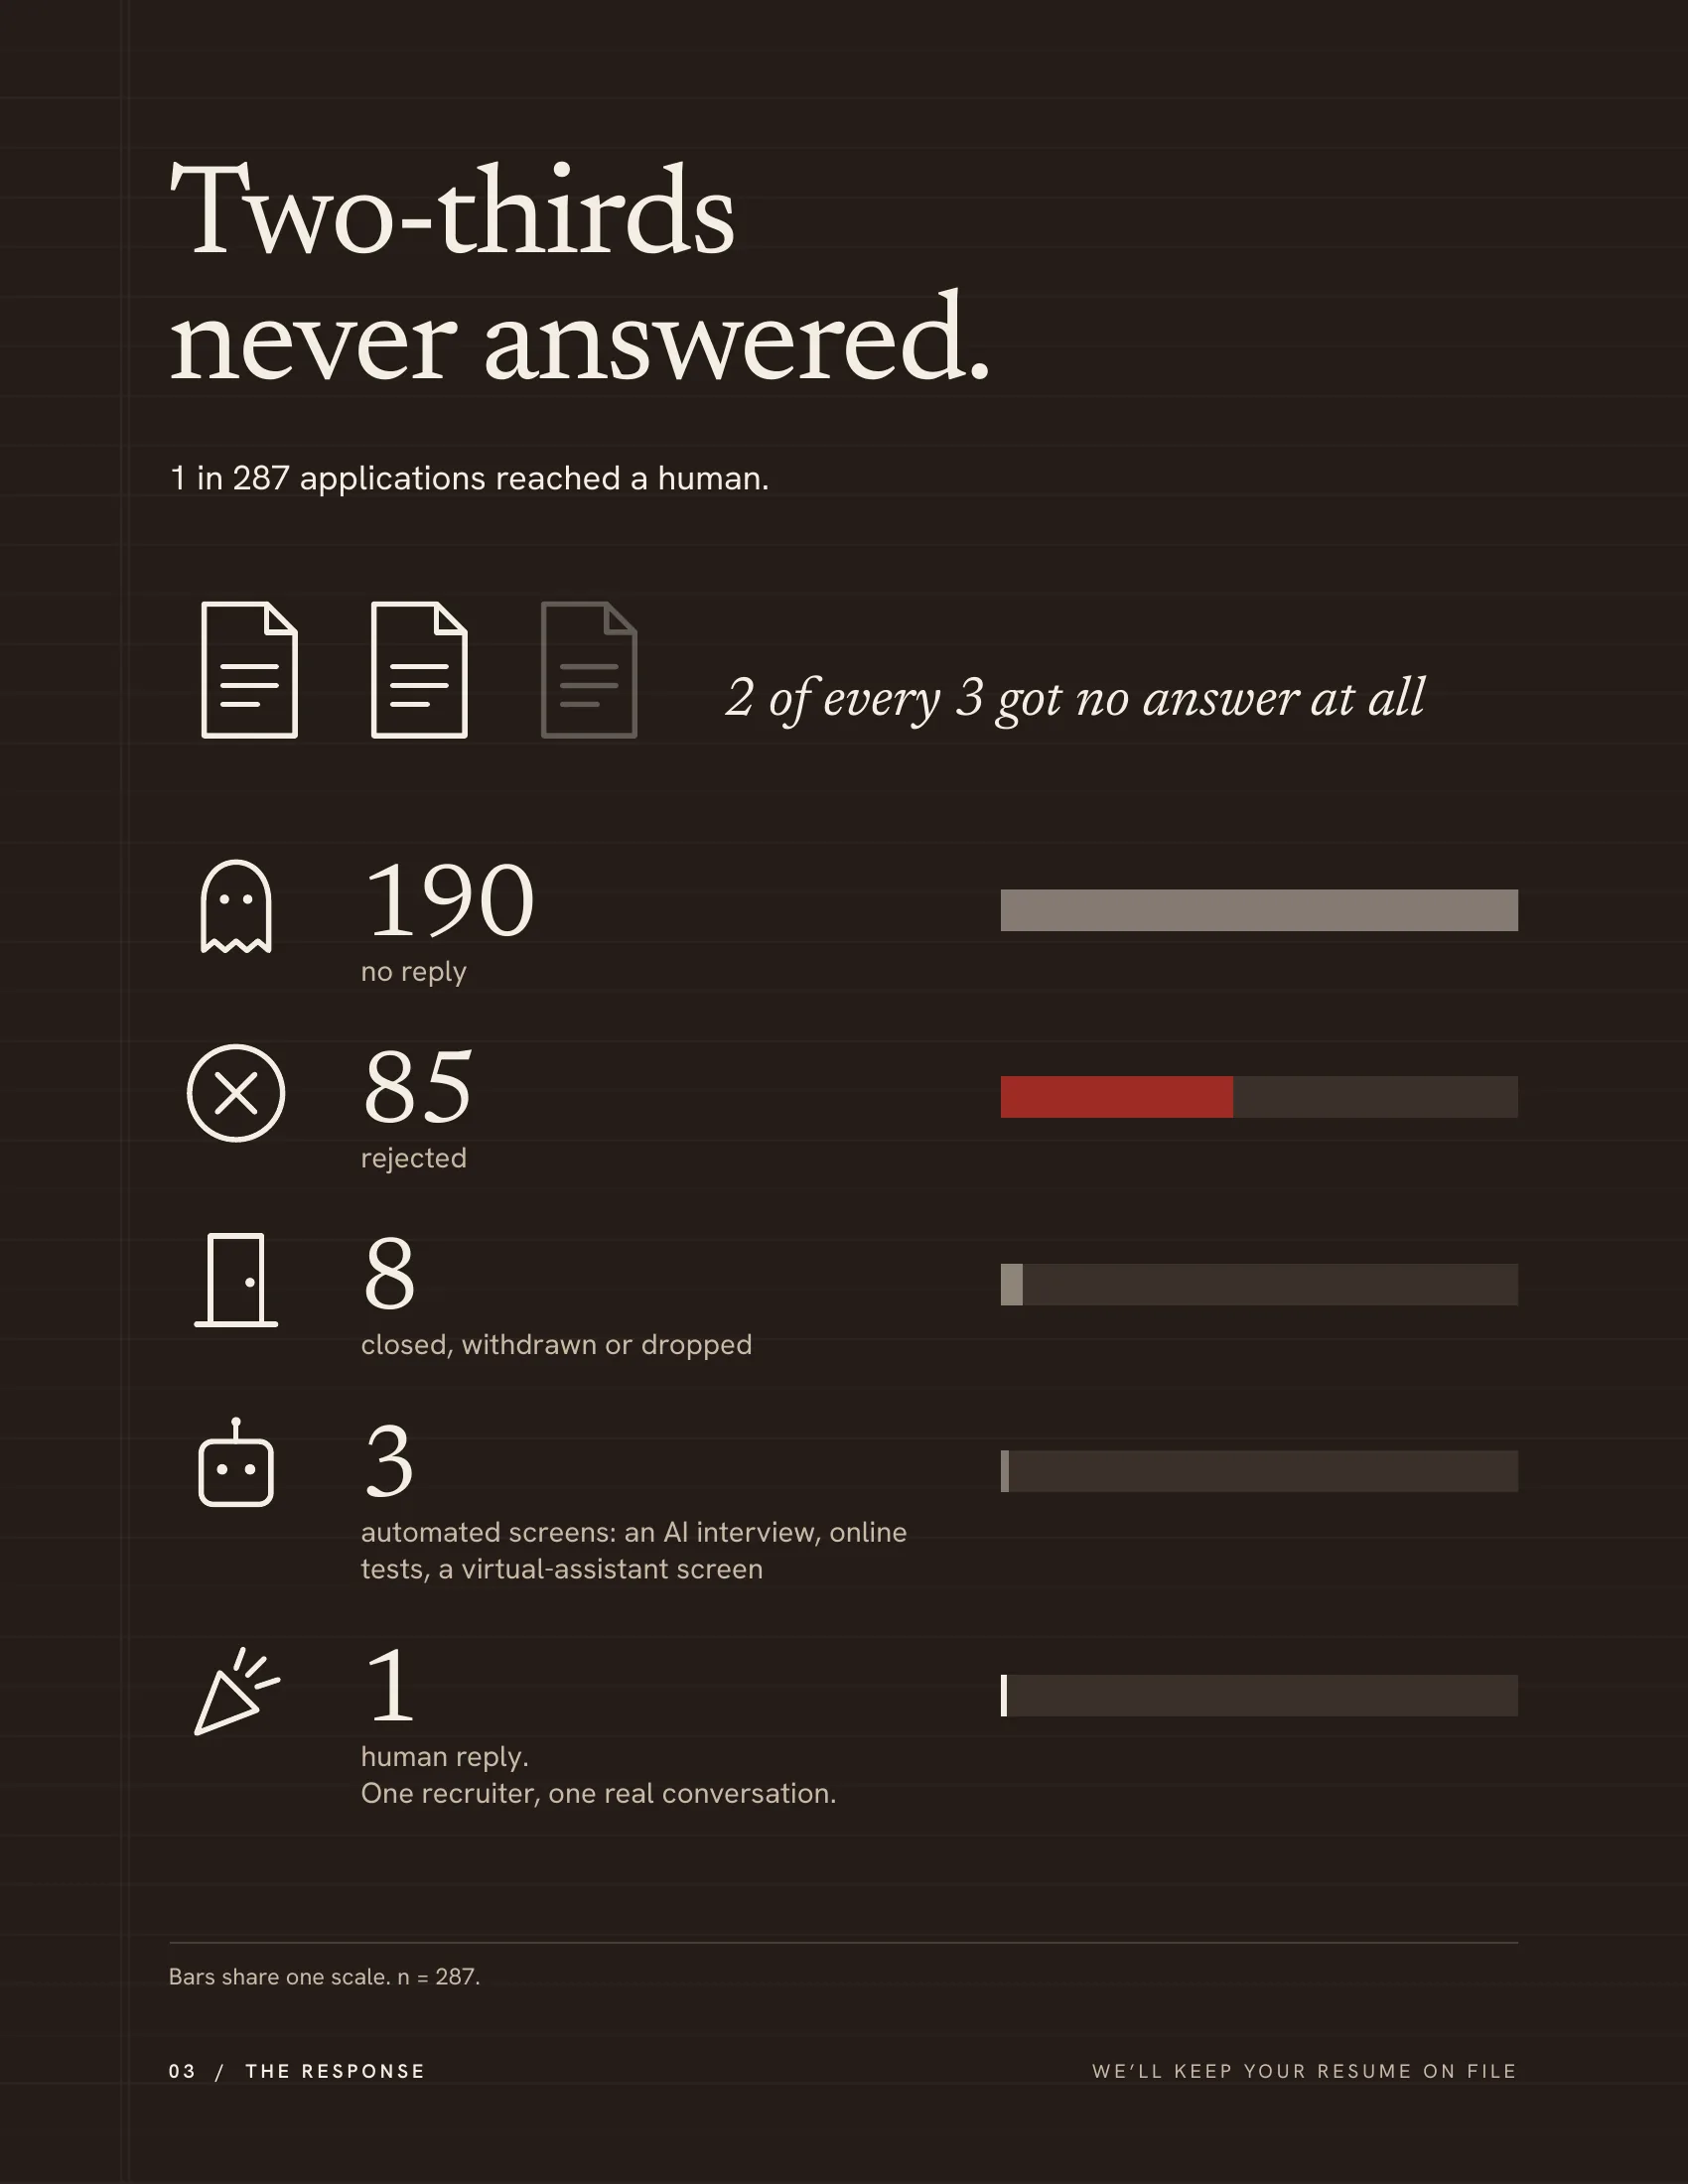
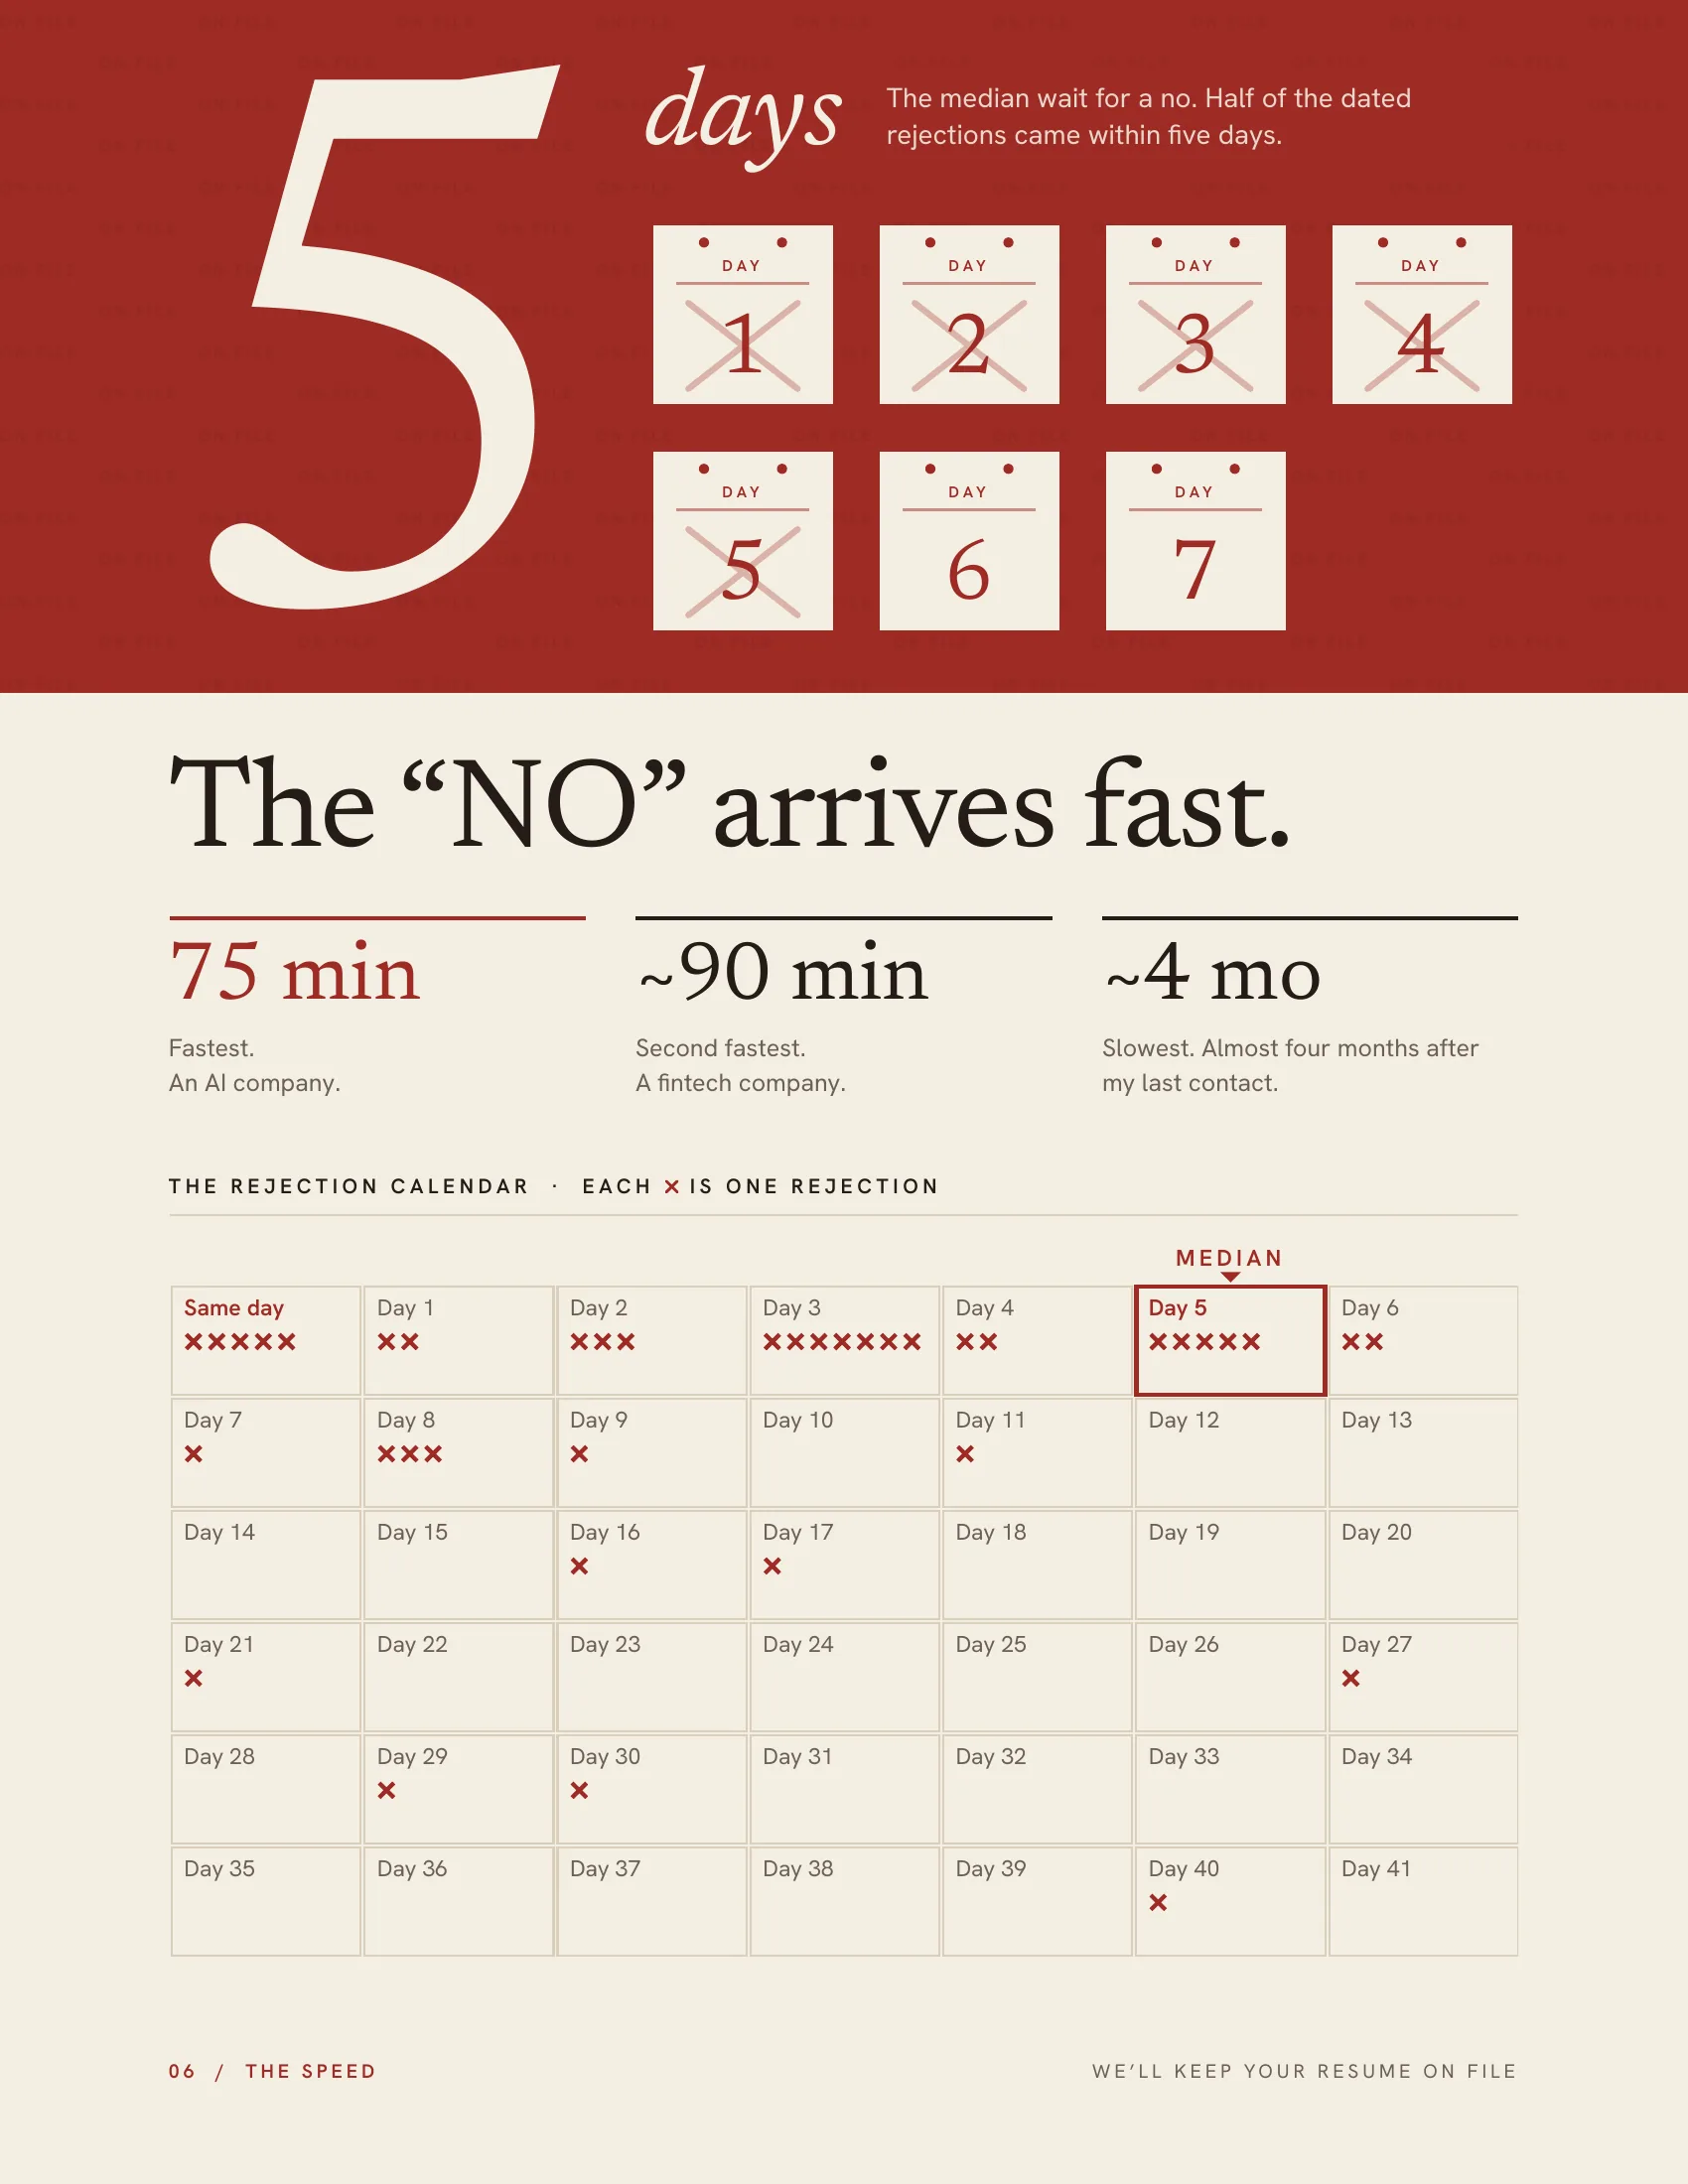
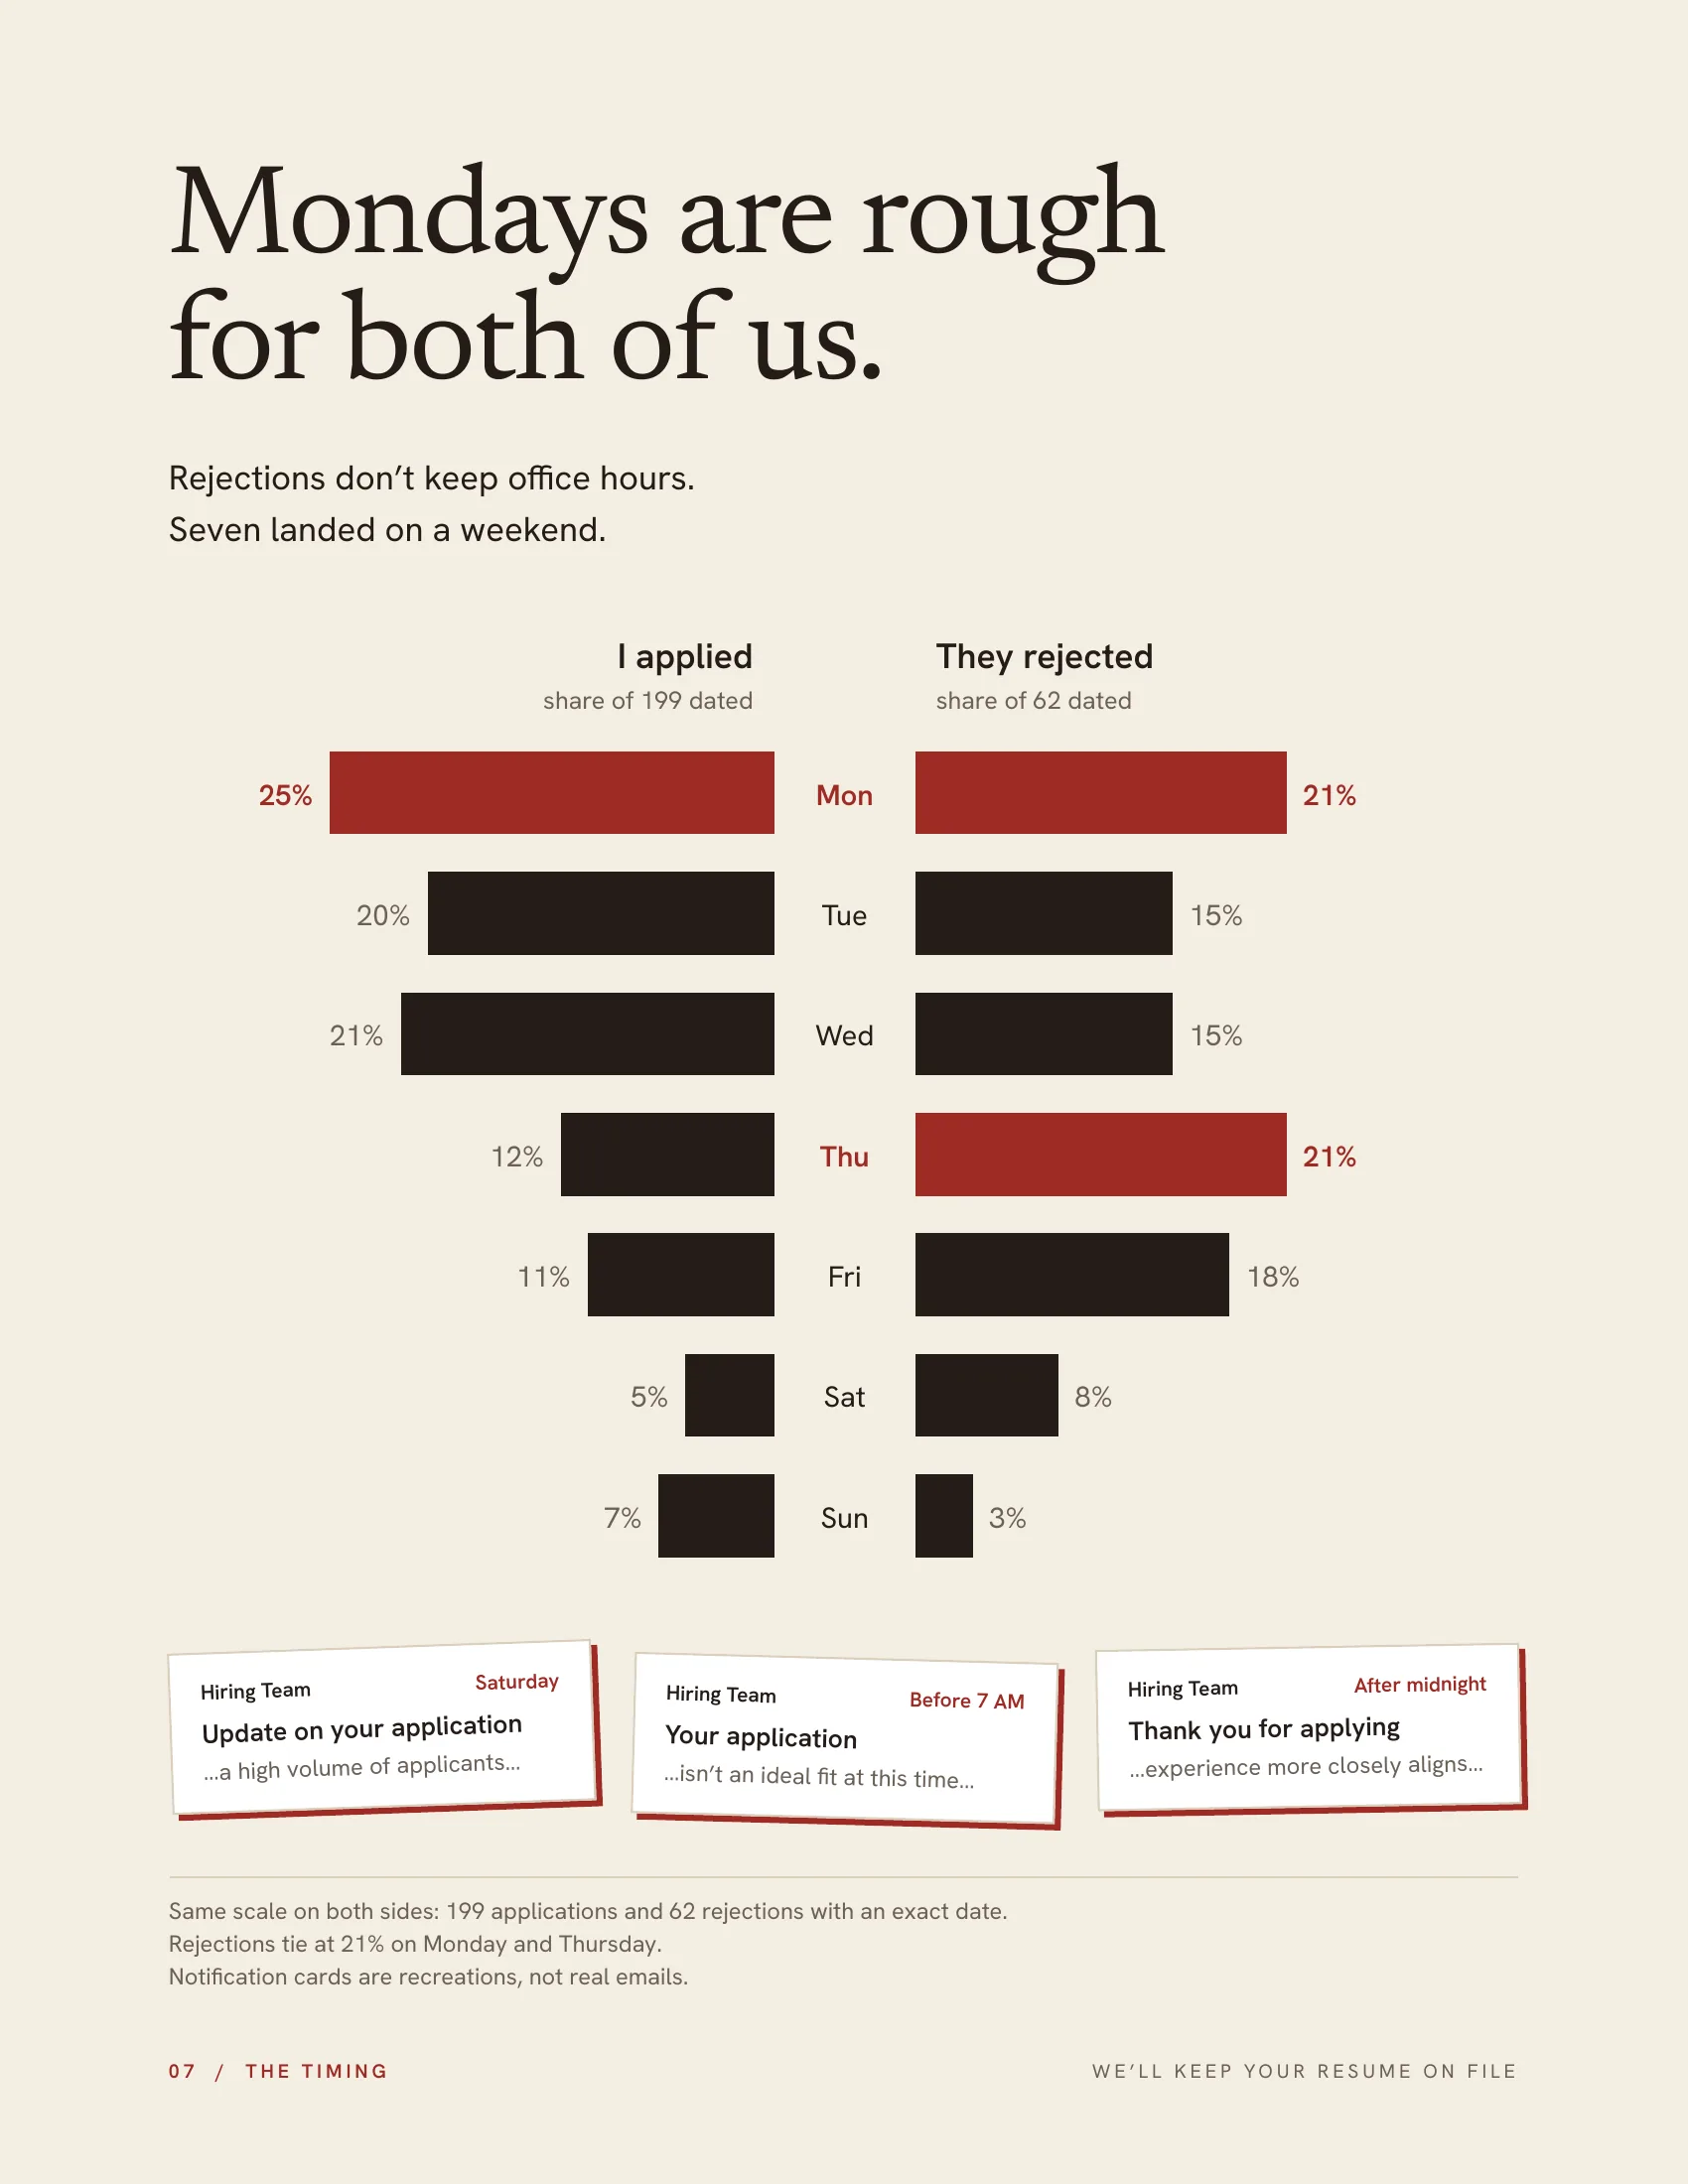
Two-thirds never answered: 190 of 287 got no reply at all. The no arrives fast, with a median wait of five days and a fastest of 75 minutes. Rejections cluster on Mondays and Thursdays, 21% each. And every next step (any reply that moved an application forward, AI interviews and tests included) came from a role I’d marked as a strong fit: 4 of 75, against 0 of the 212 others.
Designing it
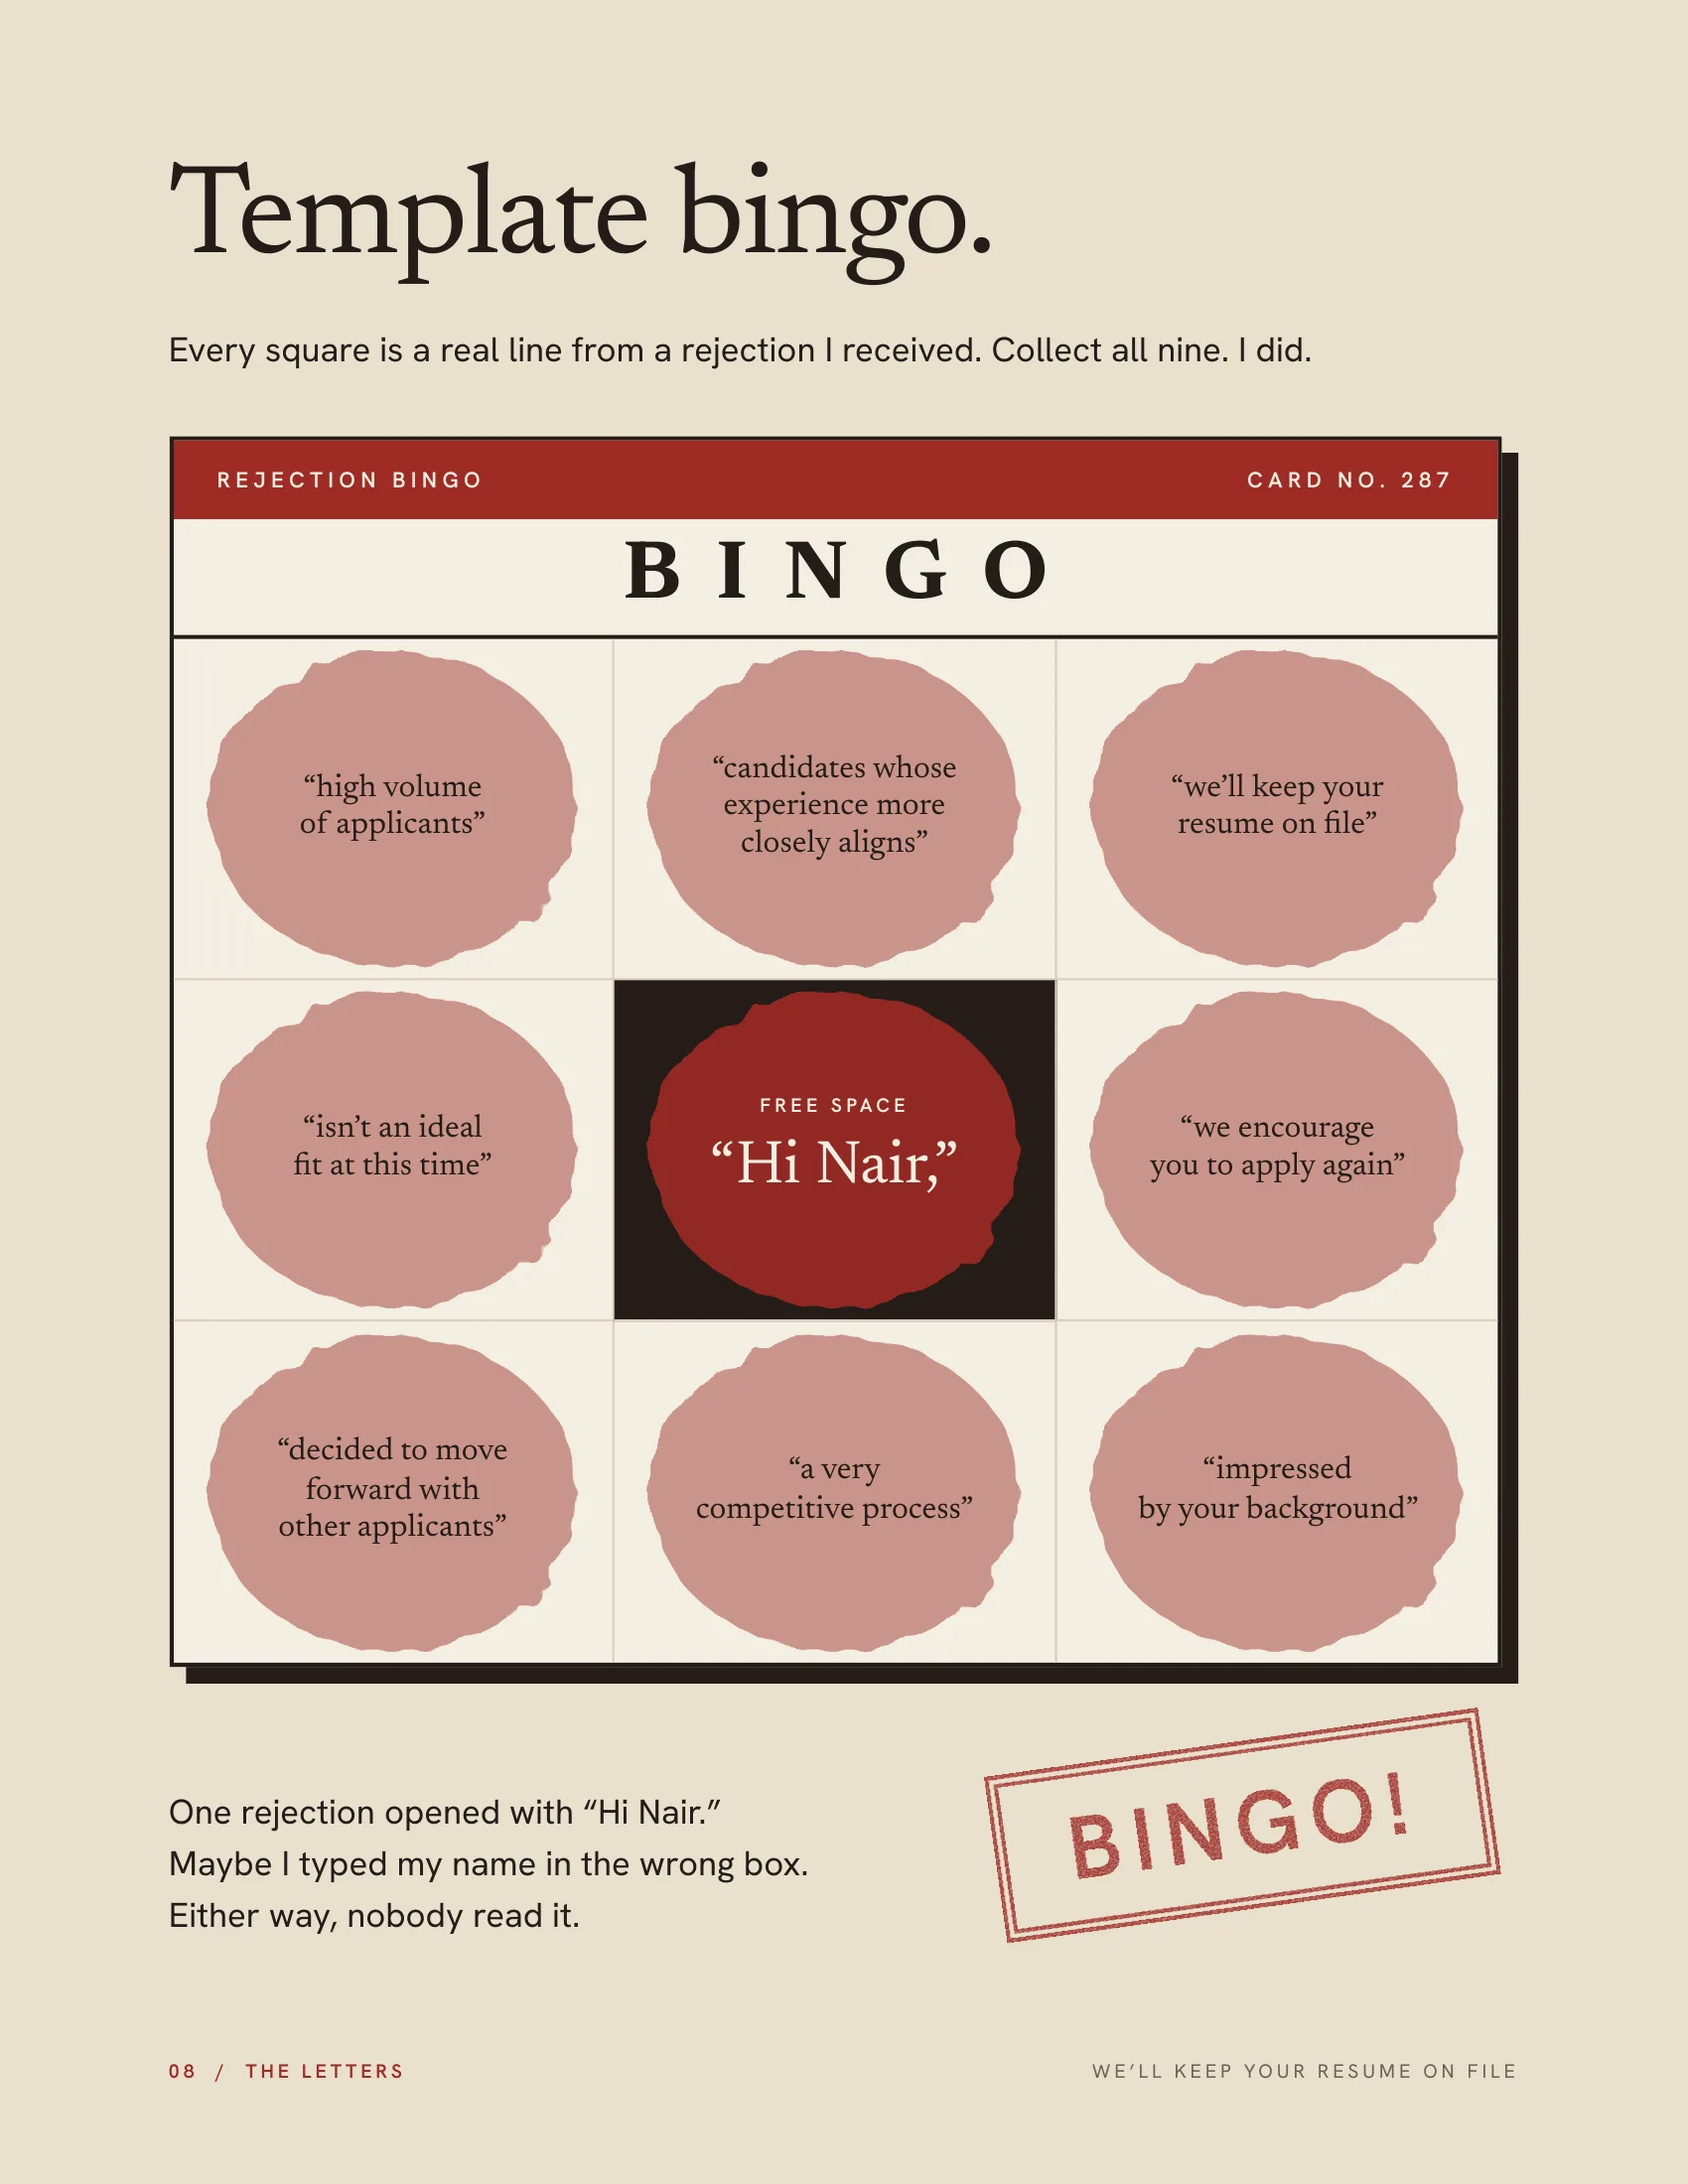
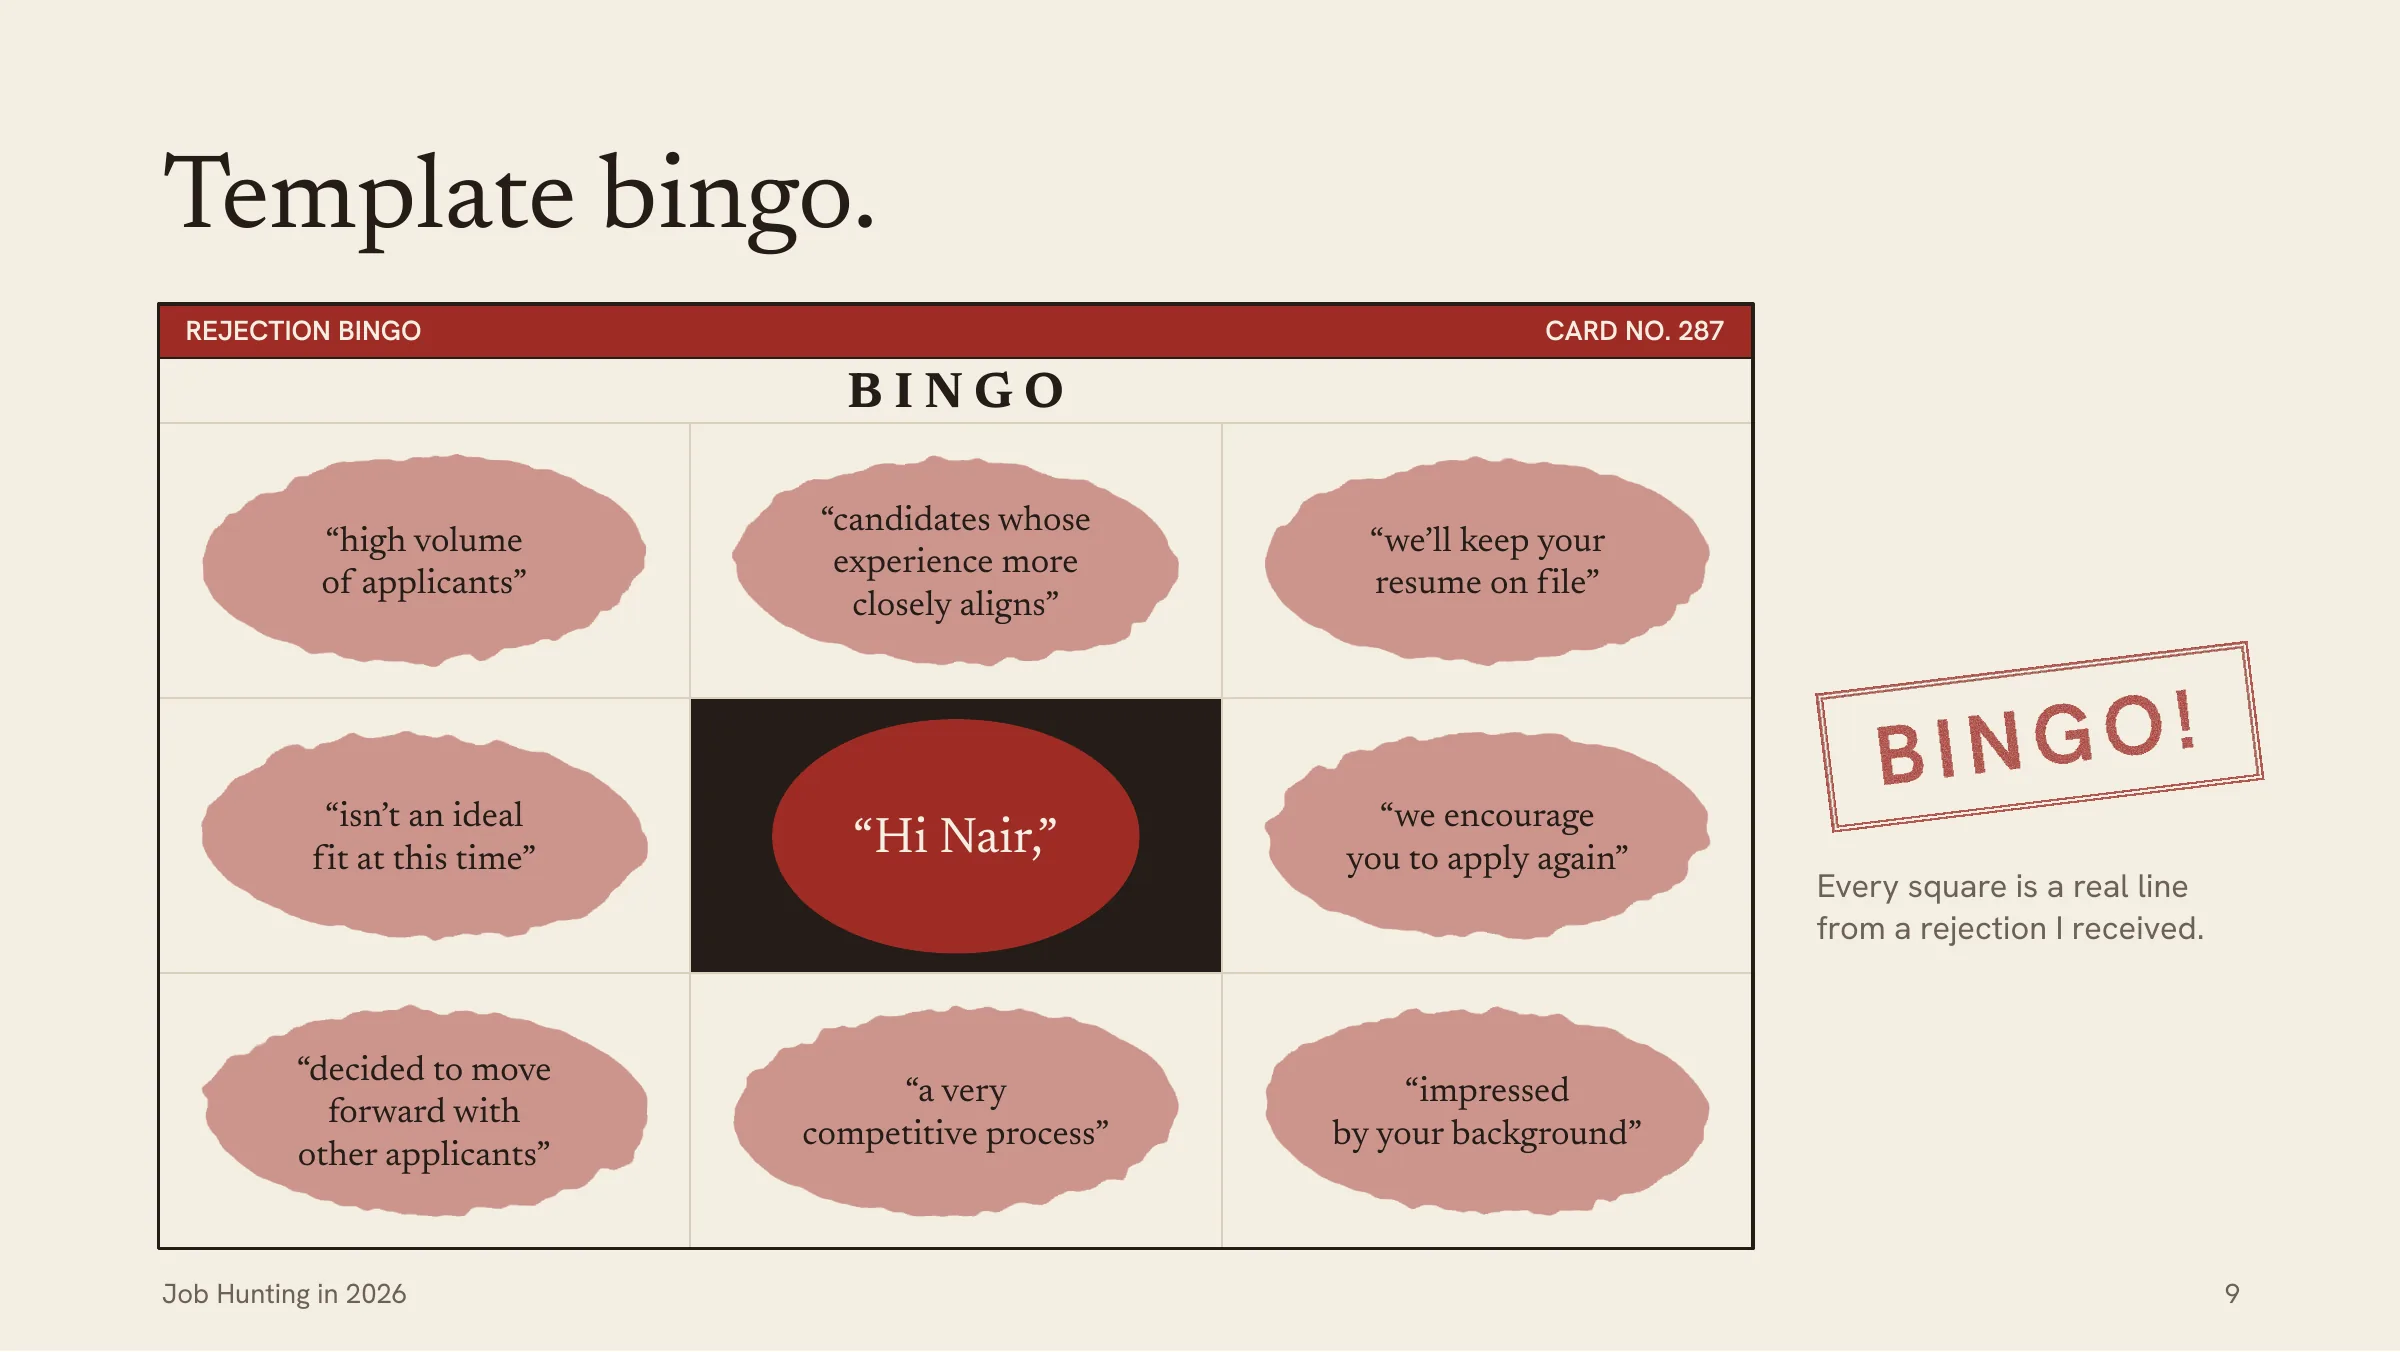
I set it as a print-style research report, not a dashboard: one finding per page, a headline that states it, one chart that proves it. Kumkumam, the red of the powder used in temple rituals, is the only accent, saved for the number that matters, and on dark pages it marks things but never carries text. The humor lives in the objects, like rubber stamps, a bingo card of real rejection phrases and a clock for the 75-minute no, so the charts can stay straight.
How it was made
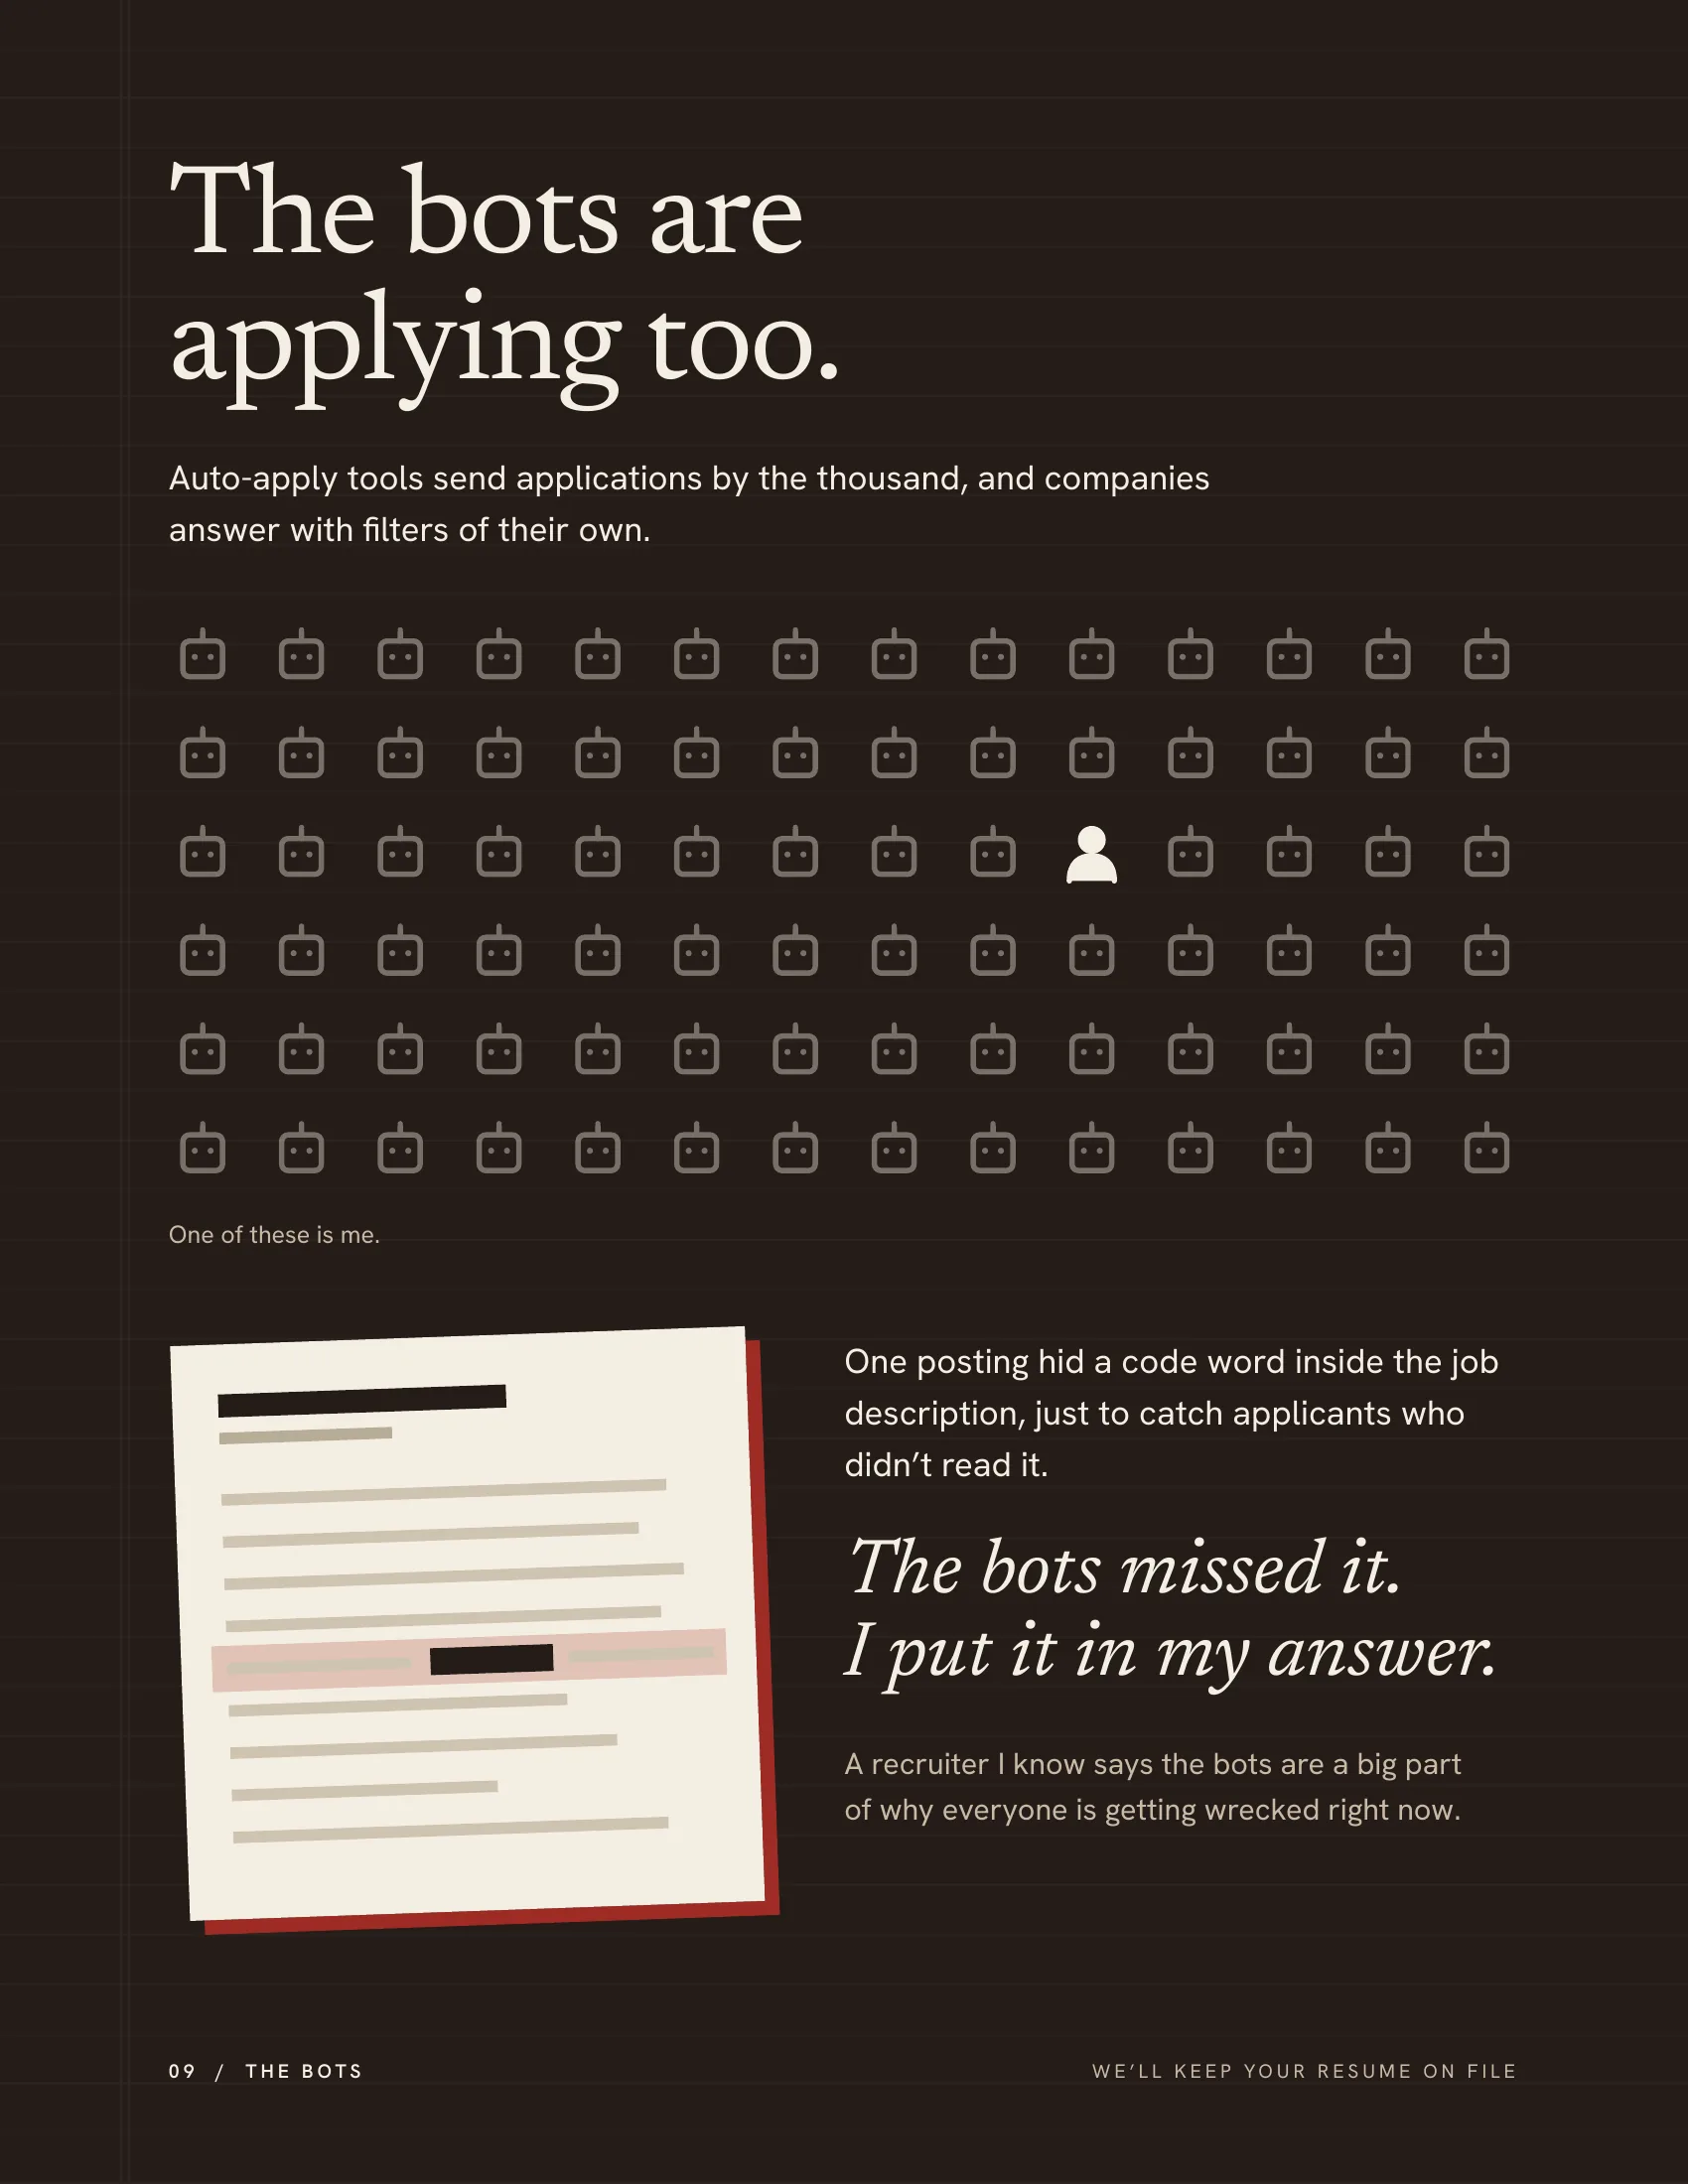
I art-directed it, set every rule and signed off on every line and number. The charts and first drafts were built with AI from those decisions. I also used AI to help draft and tailor my written answers, trained on how I actually write, then read every posting and sent every application myself. The raw tracker stays private; the report uses totals only.
What it can’t tell you
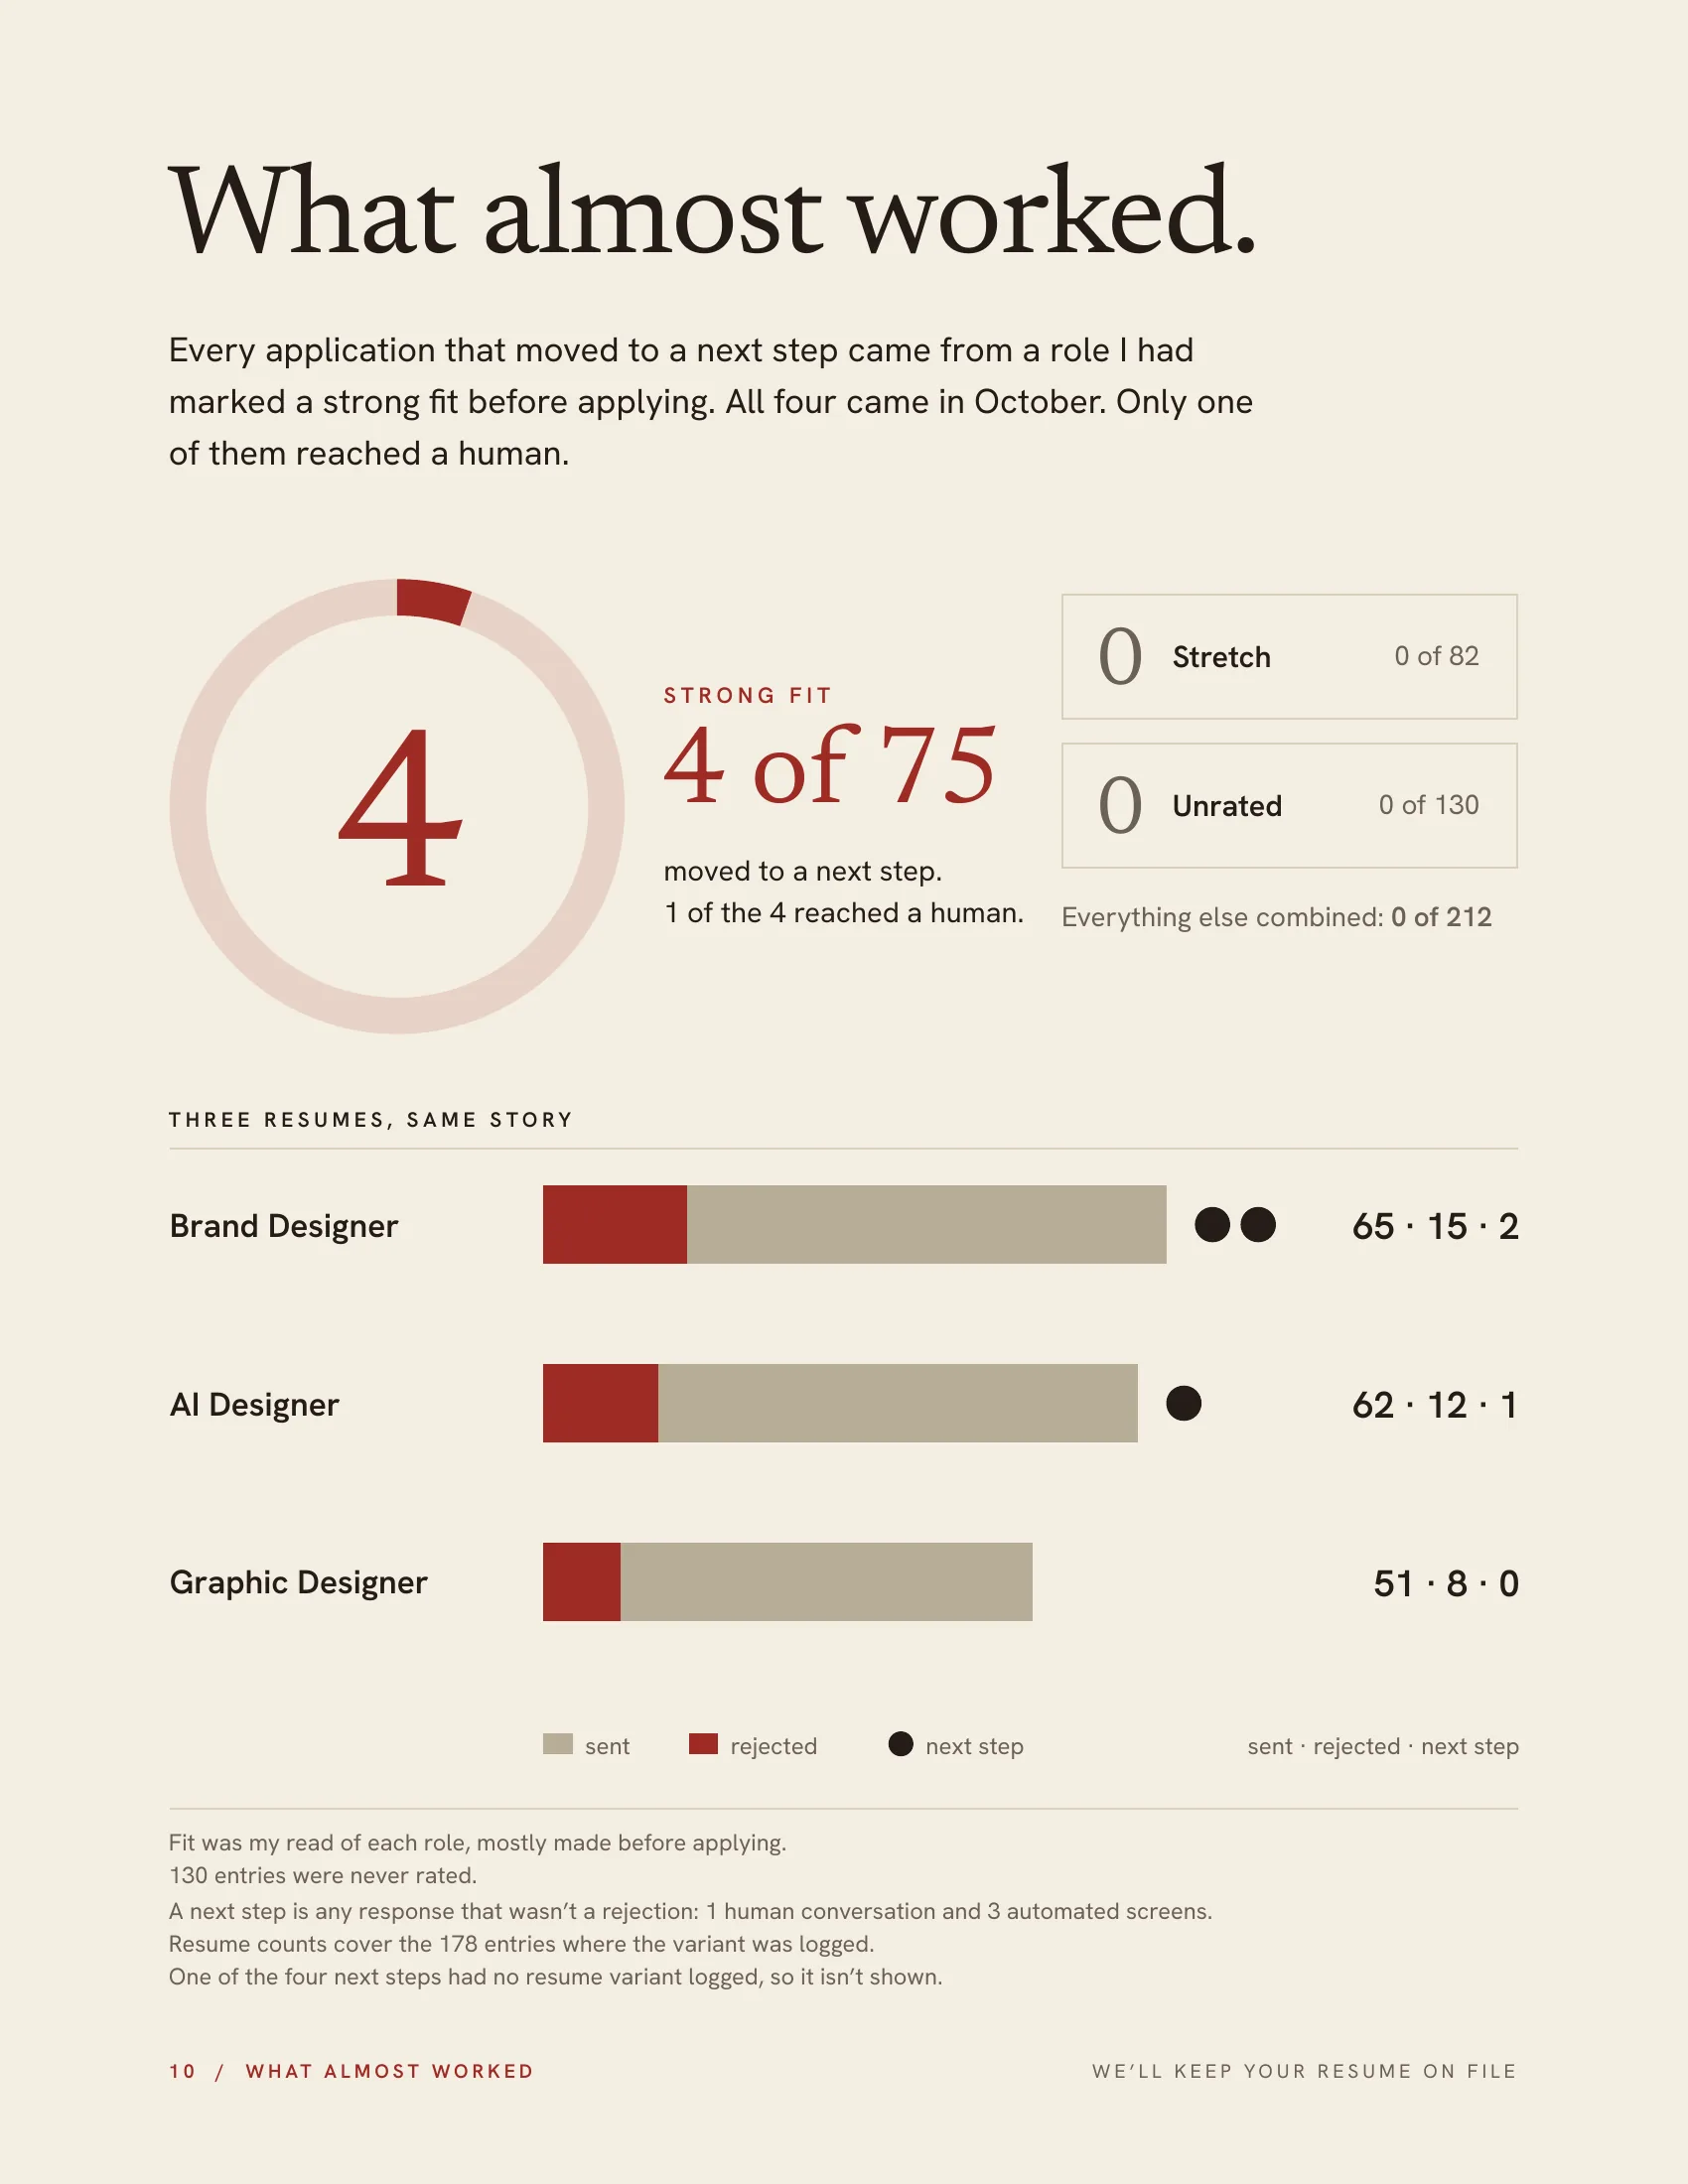
It’s one person’s search. Fit was my own read of each role, mostly made before applying, and 81 entries were logged after the fact with no date. The pattern in this data is clear. It isn’t a law of hiring.
This started as a spreadsheet I kept to stay sane and turned into the most fun project I’ve worked on this year.
Every number is real; the jokes are the only thing made up.